Learning Objectives¶
By the end of this chapter, you should be able to:
Distinguish pitch from frequency, and give two situations in which the pitch a listener reports is not the frequency present.
Describe how pitch discrimination varies across the audible range, and state the approximate just-noticeable difference in frequency.
Derive the beat frequency for two tones of nearby frequency, and explain how a piano tuner uses beats to set an interval.
Explain the missing fundamental, and use it to argue that pitch cannot be read off the place of maximum excitation alone.
Compare place and temporal theories of pitch, and state what each explains and where each fails.
Explain consonance and dissonance in terms of roughness between partials falling within a critical band.
Predict, from the spectra of two complex tones, which intervals between them will sound rough and which smooth, and relate the answer to small whole-number frequency ratios.
Explain why the consonance of an interval depends on the timbre of the instrument playing it, and give an example.
Identify combination tones and describe the conditions under which they are audible.
Introduction¶
This chapter asks two questions that look simple and are not.
What determines the pitch of a sound? The obvious answer, its frequency, is wrong often enough to be interesting. A sound can have a clear pitch at a frequency that is entirely absent from it. Two sounds of the same frequency can have different pitches, depending on how loud they are. And above about 5 kHz, pitch perception degrades badly even though hearing continues for another two octaves.
Why do some pairs of notes sound good together? This is the older question. Pythagoras is supposed to have noticed, two and a half millennia ago, that strings whose lengths are in simple whole-number ratios sound well together, and that observation has been the foundation of Western music theory ever since. But why should the ratio be pleasant and the ratio not? The numbers themselves cannot be doing anything. Something about the ear must be.
The two questions turn out to have a common answer, and it is the one Chapter 7 supplied: the critical band. Both pitch and consonance are consequences of the ear resolving frequencies with a limited but definite sharpness, and of what happens when two components fall inside one resolution element.
This chapter is also where the book stops being purely deductive. The results here are experimental facts about listeners, and the theories that explain them are good but incomplete. Where a theory fails, the text says so.
8.1Pitch and Frequency¶
The Pitch of a Pure Tone¶
For a pure tone in the middle of the audible range, pitch tracks frequency closely and monotonically. Double the frequency and listeners agree the pitch has risen by an octave. That much is uncontroversial.
But pitch depends slightly on level as well. A pure tone below about 1 kHz is heard as slightly flatter when played louder; one above about 2 kHz slightly sharper. The effect is small, a few percent at extreme levels, and it does not arise for complex tones, so it never troubles musicians. It remains decisive evidence that pitch is computed rather than measured.
Just-Noticeable Differences¶
How finely can the ear tell two frequencies apart? The answer depends on where you ask.
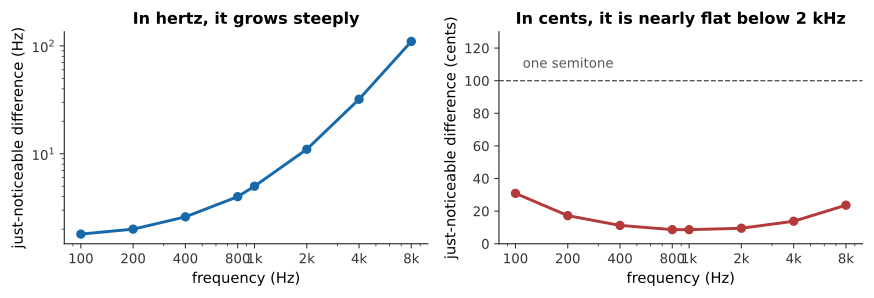
Figure 8.1:The just-noticeable difference in frequency. Expressed in hertz it grows steeply with frequency; expressed in cents, hundredths of a semitone, it is nearly constant at about 3–6 cents across the whole musically useful range, and only deteriorates above about 2 kHz.
That flatness in cents is the important result, and it reflects the logarithmic layout of the cochlea from Chapter 6. The ear’s pitch resolution is proportional, not absolute, which is exactly why music is built on ratios.
Three to six cents is extraordinarily fine. A semitone is 100 cents, so the ear resolves about one thirtieth of a semitone, far finer than any performer needs, and far finer than the differences between tuning systems that Chapter 9 will agonize over. When that chapter says a tuning system is 14 cents out, it means an error two to four times the threshold of detection.
Where Pitch and Frequency Part Company¶
Three situations break the simple correspondence, and each is instructive.
Above about 5 kHz, pitch perception deteriorates sharply. Listeners cannot reliably recognize melodies played in pure tones above this, and cannot tune intervals there. Chapter 6 gave the mechanism: phase locking in the auditory nerve fails above 4–5 kHz, so the timing information disappears and only place is left. The top note of a piano is 4186 Hz, and that is very likely not a coincidence.
Very short tones have no definite pitch. A tone must last several cycles before a pitch can be assigned, and below about 10 ms it is heard as a click. This matters for percussion and for the very lowest notes, where ten cycles of a 30 Hz tone takes a third of a second.
A complex tone can have a pitch at a frequency it does not contain. This is the big one, and §8.3 is about it.
8.2Beats¶
Two Nearby Frequencies¶
Play two tones of nearly equal frequency together. The result is a single tone, at roughly the average frequency, whose loudness rises and falls at a slow, steady rate.
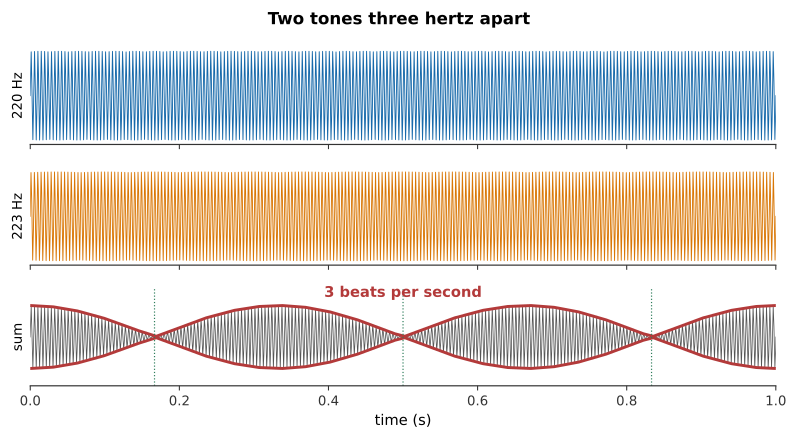
Figure 8.2:Two nearby tones, and their sum, slowed down here so the beat is visible — real musical beats like 220 and 223 Hz oscillate too fast to watch directly. The two drift in and out of step, reinforcing when they are aligned and canceling when they are opposed. In the original, the envelope completes three cycles per second, the difference between the two frequencies.
The reason is superposition (Chapter 3) in time rather than in space. Two tones at 220 and 223 Hz start in step, but the second completes three more cycles per second, so after a sixth of a second it is half a cycle ahead and they cancel; after a third of a second it is a full cycle ahead and they reinforce again.
The Beat Equation¶
The trigonometry is one line:
This is a tone at the average frequency, multiplied by a slowly varying envelope at half the difference frequency. The envelope goes through zero twice per cycle of that cosine, so the loudness peaks
times per second.
What is heard as the rate changes is not one phenomenon but a sequence of them:
| Difference | What is heard |
|---|---|
| 0–6 Hz | A single tone, throbbing. Beats can be counted. |
| 6–20 Hz | Too fast to count. A rough, fluttering quality. |
| 20 Hz to a critical band | Roughness, harsh, unpleasant, unmistakable. |
| Beyond a critical band | Two separate smooth tones. The roughness vanishes. |
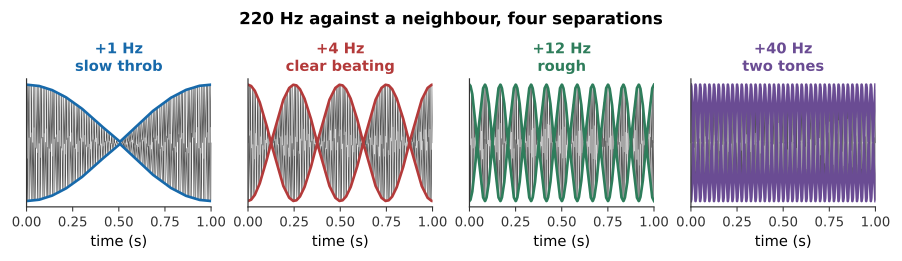
Figure 8.3:A 220 Hz tone against neighbors 1, 4, 12, and 40 Hz away. Listen for the transition between the third and fourth: the roughness does not fade gradually, it stops once the two tones are far enough apart to fall in different critical bands. That transition is the whole mechanism of §8.4.
What you hear: Four pairs of tones in succession. The first throbs about once a second; the second beats clearly; the third is rough and buzzy; the fourth has separated into two distinct smooth tones.
Listen: Beat Rates
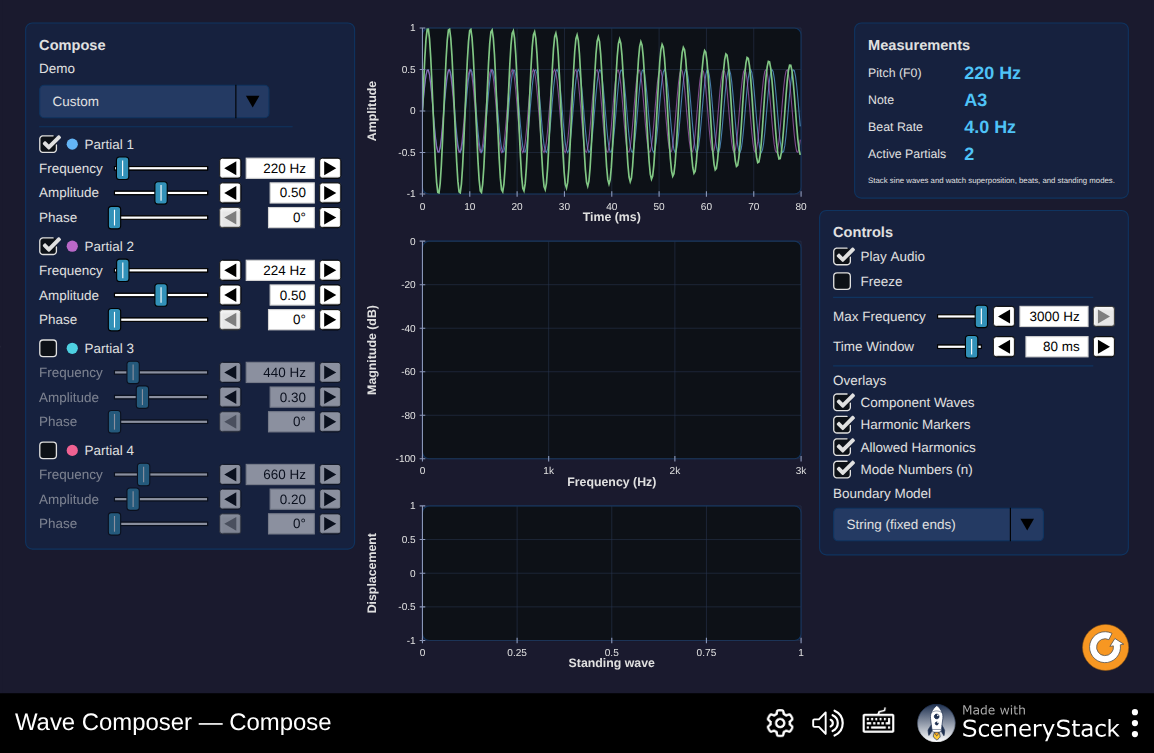
Figure 8.4:Add two sinusoids and vary the gap between them. Watch the envelope of the sum while counting the beats, and confirm that the rate is the difference of the two frequencies and not half of it, the factor of two of Exercise 8.9, visible rather than derived.
Interactive simulation: Wave Composer
Tuning by Beats¶
Beats are how instruments are actually tuned, and the method is far more precise than listening for “sameness”.
When two strings are close, the ear cannot tell which is higher. But it can count beats, and the beat rate goes to zero at the exact match. A tuner tightens one string until the beats slow, slows further, and stop. Since the ear can detect a beat rate down to a fraction of a hertz, this places the unison within a small fraction of a cent, far better than the 3–6 cent discrimination of §8.1.
The method extends to other intervals, and this is what makes Chapter 9 practical. Tune a fifth: the third harmonic of the lower note and the second harmonic of the upper should coincide at a perfect . If the fifth is slightly narrow, those two harmonics differ slightly and beat. A piano tuner setting equal temperament is counting a specified number of beats per second on each interval, for a tempered fifth near middle C, about one beat every two seconds.

Figure 8.5:Piano technician Dan Levitan demonstrates the audible beats in an imperfect unison and the clean result as its strings converge on the same frequency. The changing beat rate turns the equation above into a practical tuning method.
Watch on YouTube: Unison Tuning
8.3The Pitch of a Complex Tone¶
The Missing Fundamental¶
Take a tone with harmonics at 200, 300, 400, 500, and 600 Hz. It has a pitch of 100 Hz, even though there is no 100 Hz component in it at all, and even if the sound is played through a system that cannot reproduce 100 Hz.
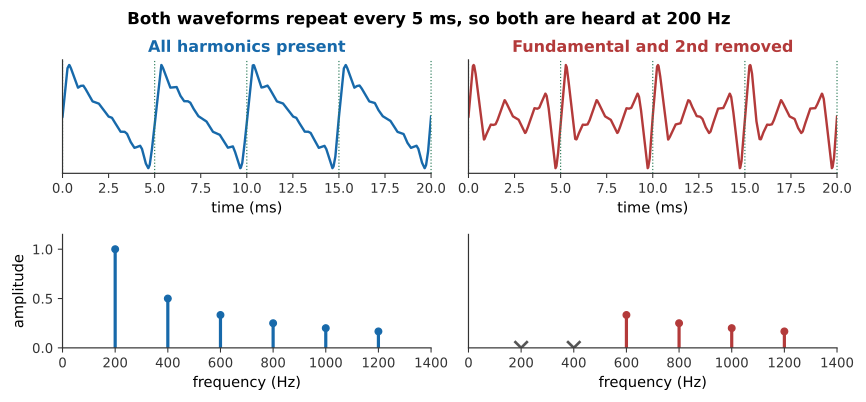
Figure 8.6:The missing fundamental. Removing the lowest partials changes the waveform’s shape but not its period, and the pitch follows the period. The dotted lines mark 5 ms intervals; both waveforms repeat on them.
Figure 8.7:A 150 Hz tone, complete and with its two lowest partials removed. The timbre changes considerably; the pitch does not move at all. If pitch were simply the lowest frequency present, the second clip would sound an octave and a fifth higher.
What you hear: Two tones. The second is thinner and less full-bodied than the first, but both are unmistakably the same note, the pitch does not jump up when the lowest partials are removed.
Listen: All harmonics, Fundamental and 2nd removed
This is not a laboratory curiosity. It is happening constantly:
A telephone passes nothing below 300 Hz, yet a male voice with a 110 Hz fundamental sounds perfectly normal on it.
A small loudspeaker cannot reproduce 40 Hz, yet a bass guitar’s low E is recognizable through it.
Organ builders exploit it deliberately: a resultant stop sounds two pipes a fifth apart, and listeners hear a note an octave below the lower one, which no pipe in the building is producing.
Virtual Pitch and Pattern Matching¶
The explanation now generally accepted is that the auditory system finds the fundamental that best explains the partials it is receiving.
Given components at 200, 300, 400, 500 Hz, the system searches for a fundamental of which all are harmonics. 100 Hz works, they are its 2nd, 3rd, 4th, and 5th harmonics, and nothing higher does. So 100 Hz is reported.
This is a pattern-matching operation, and it is doing a genuinely useful job. In a room full of sound, the ear receives dozens of frequency components at once, from several sources. Grouping them into harmonic families is how it decides which components belong to which source, the classic “cocktail party” problem, and the perceived pitch is a by-product of that grouping.
Two pieces of evidence make it clear the mechanism is not merely arithmetic on the lowest partial:
Mistuning one harmonic shifts the pitch. Take harmonics at 200, 300, 400 Hz and move the 400 to 420. The perceived pitch rises slightly, to about 103 Hz, as though the system had compromised among competing candidates. A rule that merely computed the difference between adjacent partials would not do this.
The partials can be split between the ears. Present odd harmonics to one ear and even harmonics to the other and a single pitch is still heard at the fundamental. Whatever is doing the computation is in the brain, downstream of both cochleas.
Place Theory, Temporal Theory, and the Evidence¶
Two mechanisms have long competed to explain pitch, and the honest summary is that the auditory system uses both.
Place theory says pitch is read off where on the basilar membrane the excitation peaks. It explains why pitch perception survives at high frequencies, it explains masking, and it is undeniably part of the story because the tonotopic map exists.
Its problems are serious. It cannot easily account for the missing fundamental, since there is no excitation at the missing place. And it predicts far worse frequency resolution than listeners achieve: Chapter 6 put a critical band at about four semitones, while the ear resolves four cents.
Temporal theory says pitch is read off the timing of nerve firings, which phase-lock to the waveform. It explains the missing fundamental immediately, the waveform’s period is unchanged by removing the fundamental, and it explains the fine resolution, since timing can be measured very precisely.
Its problem is equally serious: phase locking fails above 4–5 kHz, and pitch perception, while degraded, does not vanish.
The evidence points to a division of labor. Below about 5 kHz, where music lives, timing dominates and gives fine resolution and the missing fundamental. Above it, only place is available, and performance degrades accordingly, which is exactly the pattern observed.
8.4Consonance and Dissonance¶
Roughness and the Critical Band¶
Now Pythagoras’s question. The modern answer, due in its quantitative form to Plomp and Levelt in 1965, is this:
Two partials sound rough when they are close enough to fall within one critical band, but not so close that they merely beat slowly.
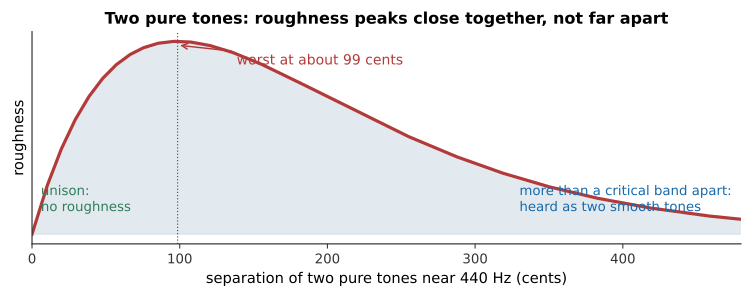
Figure 8.8:Roughness between two pure tones. At unison there is none; it rises to a maximum when the two are separated by roughly a quarter of a critical band, here about 70 cents, less than a semitone, and dies away once they are more than a critical band apart.
That figure is easily misread, so be explicit: for two pure tones, the most dissonant interval is a small one, around a semitone, and everything wider is progressively smoother. There is nothing special about a fifth, nothing special about an octave, and no preference for simple ratios anywhere in it.
Which raises the obvious objection. Music is not made of pure tones.
Why Simple Ratios Sound Smooth¶
Real musical tones have many partials, and the roughness of two complex tones is the sum of the roughnesses of every pair of partials.
Now the simple ratios earn their reputation. Two tones a perfect fifth apart, with harmonic partials, have partials at
The upper tone’s 2nd partial coincides exactly with the lower tone’s 3rd. Its 4th coincides with the lower’s 6th. Coinciding partials contribute no roughness at all, and every coincidence is one fewer clashing pair.
Detune the fifth slightly and those coincidences become near-misses, pairs of partials a few hertz apart, which is exactly the recipe for beating and roughness.
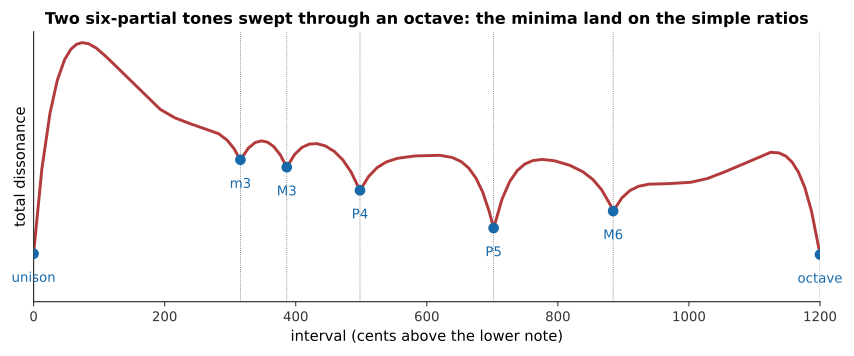
Figure 8.9:Total dissonance between two six-partial harmonic tones, computed by summing the roughness of every pair of partials as the upper note sweeps up an octave. The minima fall on the simple ratios, and nobody put them there. The curve was computed from a model of the ear’s critical bands, with no musical knowledge in it at all.
That figure is, to my mind, the most satisfying result in the book. The consonant intervals of Western music emerge from a model containing nothing but the ear’s frequency resolution and the fact that instruments produce harmonic partials.
Figure 8.10:The same sweep, heard rather than computed. Follow it against the figure. The smooth points are not marked by anything in the sound generator, it simply glides, and yet they arrive on the fourth, the fifth, and the octave.
What you hear: Two tones, the upper gliding slowly up an octave over sixteen seconds. The sound roughens and smooths repeatedly; the smooth points arrive at the familiar consonant intervals, and the roughest region is just above the unison.
Listen: Interval Sweep
Figure 8.11:3Blue1Brown approaches consonance through rational numbers and measure theory. It complements the chapter’s physical account of beating and roughness by showing why simple frequency ratios occupy a mathematically special place.
Watch on YouTube: Music and Measure Theory
Dissonance Curves¶
The curve above is specific to six harmonic partials falling as . Change the timbre and the curve changes.
More partials deepen and sharpen the minima, because there are more coincidences to be had. Rich timbres make consonance more definite.
Fewer partials flatten the curve. Two pure tones give no minima at all, as the roughness figure showed.
Inharmonic partials move the minima somewhere else entirely.
Consonance Depends on the Instrument¶
That last point deserves its own demonstration, because it overturns something most musicians assume.
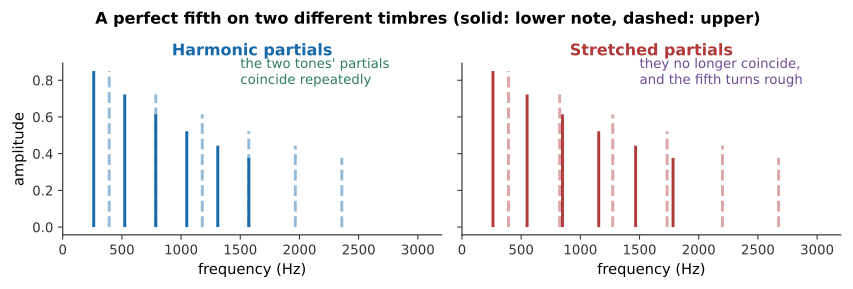
Figure 8.12:A perfect fifth, an exact , played on harmonic partials and on stretched ones. The ratio is identical in both. What changes is whether the partials of the two tones coincide, and with the stretched timbre they no longer do.
What you hear: The same interval twice. On the first timbre it is clean and settled; on the second, whose partials have been stretched, the same 3:2 ratio sounds distinctly rough and unresolved.
Listen: Harmonic fifth, Stretched-partial fifth
The conclusion, which is William Sethares’s, is worth stating plainly: consonance is not a property of a frequency ratio. It is a relationship between a ratio and a timbre. Simple ratios sound consonant on instruments with harmonic partials, and instruments with harmonic partials are what strings and air columns produce (Chapter 3). The Western scale and the Western orchestra fit each other because they grew up together.
This also explains, without any appeal to cultural relativism or its opposite, why the gamelan sounds out of tune to a Western ear and perfectly in tune to a Javanese one. Gamelan instruments are metallophones and gongs, whose partials are inharmonic (Chapter 12). Their dissonance curve has minima in different places, and the slendro and pelog scales sit on those minima. Both traditions are doing the same thing, choosing intervals that minimize roughness for their instruments, and arriving at different answers because their instruments are different.
8.5Combination Tones and the Limits of the Theory¶
Combination Tones¶
Play two loud tones and a listener may hear additional tones that are not present in the signal at all. The most prominent is the difference tone at ; others appear at and elsewhere.
These are not beats. Beats are a variation in the loudness of a tone at the average frequency; combination tones are heard as separate tones at genuinely different pitches.
The cause is nonlinearity in the ear. The cochlear amplifier of Chapter 6 is not a linear device, and any nonlinearity applied to a sum of two sinusoids generates components at sums and differences of their frequencies. Violinists use the effect to check double stops: play two notes, listen for the difference tone, and its being in tune confirms the interval is.
What Roughness Does Not Explain¶
The roughness account is good. It is not complete, and three gaps are worth naming.
Roughness does not explain the pull of a resolution. A dominant seventh chord in tonal music demands to resolve, and the demand is far stronger than its modest roughness would justify. Musical expectation is learned, and it is doing work that acoustics does not describe.
Roughness is not the same as unpleasantness. Plenty of music is deliberately rough, and it is not thereby bad. Distorted guitar is almost pure roughness, and it is one of the most popular sounds of the last seventy years.
Roughness does not explain the octave. The octave has a special status, notes an octave apart are heard as “the same note”, named with the same letter in essentially every musical culture, that goes well beyond its being smooth. A major sixth is nearly as smooth, and nobody calls it the same note.
The honest position is that the roughness model explains the sensory component of consonance well, and that musical consonance has a learned component on top of it that physics does not reach. This book will not pretend otherwise.
8.6Summary¶
Pitch resolution is proportional: the just-noticeable difference is roughly 3–6 cents across the musical range, reflecting the cochlea’s logarithmic map. It deteriorates above about 2 kHz and pitch perception largely fails above 5 kHz, where phase locking stops.
Beats between two nearby tones occur at , since the sum is a tone at the average frequency modulated by an envelope at half the difference. Tuning by beats is far more precise than tuning by matching.
The missing fundamental: a complex tone’s pitch corresponds to the fundamental of its harmonic series, whether or not energy is present there. This is pattern matching, not arithmetic on the lowest partial, mistuning one harmonic shifts the perceived pitch, and the partials can be split between the ears.
Place and temporal theories both contribute. Timing dominates below 5 kHz and gives fine resolution and the missing fundamental; place takes over above, and performance degrades.
Roughness arises when two partials fall within one critical band but are too far apart to beat slowly. For two pure tones, the roughest interval is about a semitone, and simple ratios have no special status.
For complex tones, simple ratios are smooth because their partials coincide. Summing the roughness of every pair of partials produces a dissonance curve whose minima fall on the consonant intervals, derived from the ear alone, with no musical input.
Consonance is a relationship between a ratio and a timbre, not a property of the ratio. Stretch the partials and the fifth turns rough; gamelan scales sit on the minima of their instruments’ inharmonic partials.
Combination tones at and elsewhere arise from nonlinearity in the ear and are heard as separate pitches, not as beats.
The model has limits. It does not explain harmonic expectation, it does not equate roughness with unpleasantness, and it does not explain the special status of the octave.
8.7Check Your Understanding¶
Five short, auto-graded questions cycle within one compact activity, using five different response styles.
Multiple choice. Pure tones at 440 Hz and 446 Hz sound together. Is the beat rate 3, 6, 443, or 886 beats per second?
True or false. A missing-fundamental pitch can be heard only when there is physical energy at the fundamental frequency.
Drag the words. Match beats, roughness, a combination tone, and a missing fundamental to their physical or perceptual origins.
Fill in the blank. Partials at 300, 400, and 500 Hz imply a missing fundamental of ___ Hz.
Mark the words. Identify intervals where harmonic complex tones tend to produce strong roughness minima: “Strong minima occur near the unison, octave, fifth, and fourth because many partials coincide; a semitone usually remains rough.”
8.8Conceptual Questions¶
Explain why the just-noticeable difference in pitch is nearly constant in cents but grows steeply in hertz, and relate this to the cochlea.
A piano tuner tunes a unison by listening for beats rather than by listening for sameness. Explain why this is more precise.
Explain how a telephone that transmits nothing below 300 Hz can convey a male voice whose fundamental is 110 Hz without the pitch sounding wrong.
State one piece of evidence that the missing fundamental is not computed simply as the difference between adjacent partials.
Explain why place theory struggles with the ear’s pitch resolution, and why temporal theory struggles above 5 kHz.
Two pure tones a perfect fifth apart sound smooth, but so do two pure tones a tritone apart. Explain why simple ratios acquire their special status only for complex tones.
Explain why an interval that is consonant on a violin can be dissonant on a gamelan instrument, without appealing to cultural preference.
Give one musical phenomenon the roughness model does not explain, and say what kind of explanation it would need instead.
8.9Problems¶
Solution to Exercise 8.1 #
(a) Hz.
(b) The perceived tone is at the average:
(c) s.
Therefore, a 442 Hz tone throbbing four times a second, with a quarter-second between peaks: an easily countable rate, and the working range for tuning.
Solution to Exercise 8.2 #
(a) Three beats per second means the two differ by 3 Hz:
(b) Tightening raises the pitch. If the string had been flat at 243.9 Hz, tightening would move it toward 246.9 and the beats would slow. They sped up, so the string was already sharp, at 249.9 Hz.
Therefore, the string was at 249.9 Hz and must be loosened. This “tighten and see which way the beats go” test is the standard way to resolve the ambiguity, and it is exactly why the beat method works when simple comparison does not.
Solution to Exercise 8.3 #
(a) The partials are spaced 220 Hz apart and all are multiples of 220 Hz, so Hz.
(b) , , , : the 2nd through 5th harmonics.
(c) 220 Hz.
Therefore, the pitch heard is A3 at 220 Hz, an octave below the lowest partial actually present. Note that 440 Hz alone would also be consistent with partials at 440 and 880, but not with 660 and 1100; so the pattern-matching account settles on 220.
Solution to Exercise 8.4 #
(a) Equal-tempered:
Just:
(b) The relevant harmonics:
Therefore, the tempered major third beats about ten times a second, fast enough to be heard as a distinct shimmer rather than counted. The equal-tempered third is therefore the interval musicians most often complain about, and Chapter 9’s meantone temperaments were willing to sacrifice so much to improve it.
Solution to Exercise 8.5 #
(a) Four cents is a ratio of , so
(b) The just third is 327.0 Hz and the tempered one 329.6 Hz, a difference of
Therefore, the discrepancy between the two thirds is about three and a half times the threshold of detection, comfortably audible, and precisely the reason tuning systems are argued about.
Solution to Exercise 8.6 #
(a) They differ by 80 Hz, which is half the critical bandwidth; so yes, comfortably within one band.
(b) 80 Hz is far too fast to count as beats and well inside a critical band: the prediction is roughness, a harsh buzzing quality, and the two are not heard as separate tones.
(c) 400 Hz apart, which is two and a half critical bandwidths. They fall in separate bands, so the prediction is two smooth, separate tones with no roughness.
Therefore, the same pair of pure tones can be rough or smooth depending only on their separation relative to the critical band, and 400 Hz, a major sixth, is smooth not because of its ratio but because it is wide.
Solution to Exercise 8.7 #
(a) Lower (200 Hz): 200, 400, 600, 800, 1000, 1200.
Upper (300 Hz): 300, 600, 900, 1200, 1500, 1800.
(b) Coincidences: 600 Hz (lower’s 3rd with upper’s 2nd) and 1200 Hz (lower’s 6th with upper’s 4th).
(c) A coinciding pair of partials contributes zero roughness, since roughness requires a small non-zero separation. Every coincidence therefore removes a pair that would otherwise have been a candidate for clashing. Detuning the fifth slightly turns each exact coincidence into a near-miss a few hertz wide, precisely the most rough condition, so the dissonance rises steeply on either side of the exact ratio.
Therefore, the fifth’s consonance comes from its partials lining up, and the sharpness of the minimum comes from how quickly that alignment is lost.
Solution to Exercise 8.8 #
(a) A fifth above is a ratio of :
(b) The difference tone is
(c) 32.7 Hz is exactly an octave below 65.4 Hz. The listener reports a note an octave below the 8-foot stop, a 16-foot pitch, and the arrangement is called a resultant or acoustic bass.
Therefore, a builder can obtain a 16-foot pitch without a 16-foot pipe. The effect works partly through the difference tone and, more robustly, through the missing-fundamental mechanism of §8.3: 65.4 and 98.1 Hz are the 2nd and 3rd harmonics of 32.7 Hz, and the ear supplies the fundamental. It is a common solution where a church has neither the height nor the budget for the real thing.
Solution to Exercise 8.9 #
Applying the sum-to-product identity:
The modulating factor is , which completes cycles per second.
But the ear responds to the magnitude of the envelope, not its sign. The function has twice the frequency of , because it reaches a maximum both when the cosine is +1 and when it is -1. So loudness peaks occur times per second.
Therefore, the envelope oscillates at and the audible beat rate is . The factor of two comes entirely from the ear’s indifference to the sign of the envelope, and forgetting it is the classic error in this calculation.
Solution to Exercise 8.10 #
(a) A third of an octave is 400 cents, so a minor second at 100 cents is a quarter of a critical band.
(b) A quarter of a critical band is very close to where Figure 8.8 puts the roughness maximum. The prediction is maximum roughness, and the fundamentals are only the start, since every pair of corresponding harmonics is also a quarter of a critical band apart in musical terms and contributes its own roughness.
(c) A minor ninth is a minor second plus an octave. The two fundamentals are now well over a critical band apart and contribute nothing. But the upper partials still clash: the lower tone’s 2nd harmonic is a minor second below the upper tone’s fundamental, and so on up.
Therefore, the minor ninth is smoother than the minor second but by no means smooth, which matches musical practice, where the minor ninth is used as a pungent dissonance rather than as a consonance, and composers routinely spread a dissonant interval across an octave to soften it without removing it.
Solution to Exercise 8.11 #
(a) Partials at :
(b) The upper tone at 300 Hz has partials 300, 643, 1003, 1379 Hz. Comparing with the lower’s 200, 429, 669, 920: the closest approach is 669 against 643, which differ by 26 Hz. Nothing coincides.
(c) With no coincidences, and with several pairs separated by a few tens of hertz, squarely inside a critical band at these frequencies, the fifth will sound rough rather than settled.
Therefore, a ratio is not consonant on this timbre. The consonant intervals for these partials would be found by computing the dissonance curve, and they would not be the intervals of the Western scale. This is the Sethares argument of §8.4, made concrete.
Solution to Exercise 8.12 #
(a) A just major sixth is :
(b) The difference tone:
which is a perfect fifth below the lower note: a musically consonant addition.
(c) Eight cents sharp:
The difference tone has moved by 3.1 Hz, which is cents.
Therefore, an 8 cent error in the upper note produces a 20 cent shift in the difference tone: the error is amplified by a factor of 2.5. This is exactly why string players listen for difference tones when tuning double stops: the mechanism turns a marginal error into an obvious one.
Solution to Exercise 8.13 #
(a) 100 Hz: the fundamental of the combined series.
(b) Neither cochlea receives a complete harmonic series. The left receives 100, 300, 500, … which is consistent with a fundamental of 100 Hz, but the right receives 200, 400, 600, … which on its own is a perfectly good harmonic series on 200 Hz. If pitch were extracted independently in each cochlea and then combined, the listener should hear two pitches an octave apart, or should hear the right ear’s 200 Hz.
They do not. They hear a single 100 Hz pitch, which requires the partials from both ears to have been pooled before the fundamental was determined.
Therefore, pitch extraction must occur centrally, at or above the first binaural stage of the auditory pathway. No purely cochlear mechanism, place or temporal, can produce this result.
Solution to Exercise 8.14 #
(a) Taking the lower fundamental as 1:
Lower: 1, 2.76, 5.40, 8.93.
Upper (at 1.5): 1.5, 4.14, 8.10, 13.40.
Comparing: 1.5 against nothing nearby; 4.14 against 5.40 (a ratio of 1.30, far apart); 8.10 against 8.93 (a ratio of 1.10, about 170 cents, close enough to be within a critical band at these frequencies, and therefore rough).
So not only are there no coincidences, there is at least one actively clashing pair.
(b) Coincidences would require an interval such that times one of the lower partials lands on another. For instance, would put the upper fundamental on the lower’s second partial: an interval of cents, about an octave and a fourth. Ratios built from the numbers 2.76, 5.40 and 8.93 and their quotients are the candidates.
Therefore, the intervals that are consonant on this instrument are not the Western ones, and a scale built for it would not be the Western scale. Which is, of course, what gamelan tuning actually is.