Learning Objectives¶
By the end of this chapter, you should be able to:
State Fourier’s theorem for a periodic signal, and explain what it guarantees about any sustained musical tone.
Build a sawtooth, square, and triangle wave by adding harmonics, and predict the effect on the waveform of adding or removing a given partial.
Read a line spectrum: identify the fundamental, name the partials by harmonic number, and relate the spectrum to the waveform beside it.
Distinguish harmonic from partial from overtone, and use each term correctly.
Explain why two tones of the same pitch and loudness can sound entirely different, and identify the spectral features responsible.
Explain why the phase relationships among harmonics change the waveform dramatically but the timbre hardly at all, and state the limits of that rule.
Describe the attack, decay, sustain, and release of a note, and give evidence that transients matter at least as much as the steady-state spectrum for recognizing an instrument.
Read a spectrogram, and use it to describe how the spectrum of a real note changes over its duration.
Distinguish harmonic spectra from inharmonic ones and from noise, and identify which instruments produce each.
Introduction¶
A clarinet and a violin play the same note, at the same loudness, for the same length of time. Nobody has any difficulty telling them apart.
That is a problem for everything the book has said so far. Chapter 1 established that what reaches your ear is a single wiggling number, pressure at a point, as a function of time. If the pitch is the same and the loudness is the same, what is left for the difference to live in?
The answer is the shape of the wiggle, and the tool that makes shape analyzable is the subject of this chapter.
Jean-Baptiste Joseph Fourier, working on heat conduction in the 1800s, proved something that at first seems too strong to be true: any periodic waveform, however jagged, is a sum of sine waves at whole-number multiples of one frequency. Not approximately, exactly, and in only one way.
Applied to music, this says that a sustained note is completely specified by a list: how much of each harmonic it contains. That list is the spectrum, and it is the single most useful object in the rest of this book. Chapters 10 through 13 are, in the end, four long answers to the question “what spectrum does this instrument produce, and why?”
This chapter also delivers the first serious complication. The spectrum is not the whole story, and the part it leaves out, how the sound starts, turns out to matter at least as much.
5.1Fourier’s Theorem¶
Any Periodic Wave Is a Sum of Sinusoids¶
The statement, precisely: if a function repeats with period , it can be written as
where . Every component is a harmonic of : its frequency is an exact whole-number multiple.
Two features of this deserve emphasis.
Only harmonics appear. Not arbitrary frequencies, multiples of one fundamental. This is forced by the repetition: any component at a non-multiple frequency would not come back to where it started after time , and so the whole would not repeat.
The decomposition is unique. One waveform, one list of amplitudes and phases. There is no ambiguity about what a sound “is made of”.
Building a Sawtooth by Hand¶
The theorem is easier to believe once you have watched it happen.
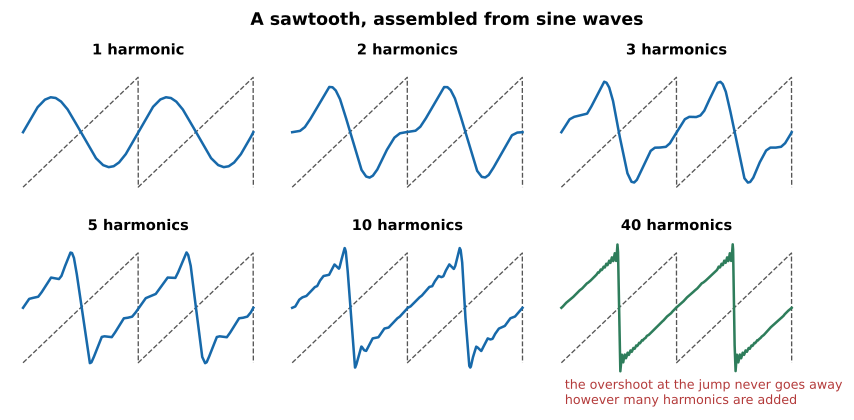
Figure 5.1:A sawtooth wave, assembled from sine waves whose amplitudes fall as . One harmonic is a sine; by ten it is recognizably a sawtooth; by forty the approximation is very close. The overshoot at each vertical jump, however, never disappears, it only gets narrower. That is the Gibbs phenomenon, and it is a genuine property of the sum rather than an error in the drawing.
That figure should be uncomfortable the first time. The building blocks are smooth, endless, curvy sinusoids; the target has sharp corners and instantaneous jumps. Adding smooth things and getting a corner seems like cheating. It is not: the corner is what infinitely many harmonics, in exactly the right proportions, add up to.
The Fourier coefficients, as integrals
Finding the amplitudes is the same trick as §4.4 used for a plucked string, and for the same reason: sinusoids of different harmonic numbers are orthogonal over one period.
Write the series in the equivalent form
The orthogonality relations are that, over one period ,
with the same for sines, and for all and .
So multiply the series by and integrate. Every term dies except one, leaving
The amplitude and phase of the th harmonic are then and .
For the sawtooth on , the integrals give and : every harmonic present, falling as , which is what the figure above plots.
The general rule worth carrying away is that the sharper the waveform, the more slowly its harmonics die off. A discontinuity gives ; a kink in the slope gives ; a perfectly smooth wave has harmonics that vanish faster than any power. This is why sharp-cornered waveforms sound bright.
Analysis and Synthesis¶
The theorem runs in both directions, and both are used constantly.
Analysis takes a sound and finds its spectrum. This is what a spectrum analyzer does, what the fast Fourier transform computes, and what the laboratory exercises in Laboratory Exercises ask you to do to real instruments.
Synthesis takes a spectrum and builds the sound. This is additive synthesis (Chapter 15), and it is how every audio example in this book was made.
The two are exact inverses, which is a stronger claim than it may look. It means the spectrum contains everything about a periodic sound: no information is lost in going from the waveform to the list of harmonics and back again.
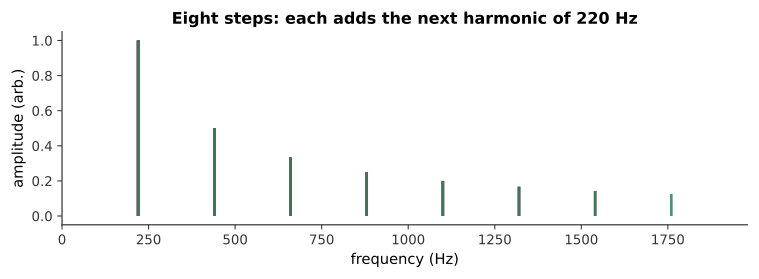
Figure 5.2:Synthesis, one harmonic at a time. Each step adds the next harmonic of 220 Hz at the amplitude a sawtooth calls for. Listen for what does not happen: the pitch never moves. Adding higher frequencies to a tone makes it brighter, not higher, which is the first and most important thing the ear does with a harmonic series.
What you hear: A tone that brightens in eight steps, growing from a plain hollow sound to a buzzy one. The pitch does not change at any point.
Listen: Harmonic Build Up
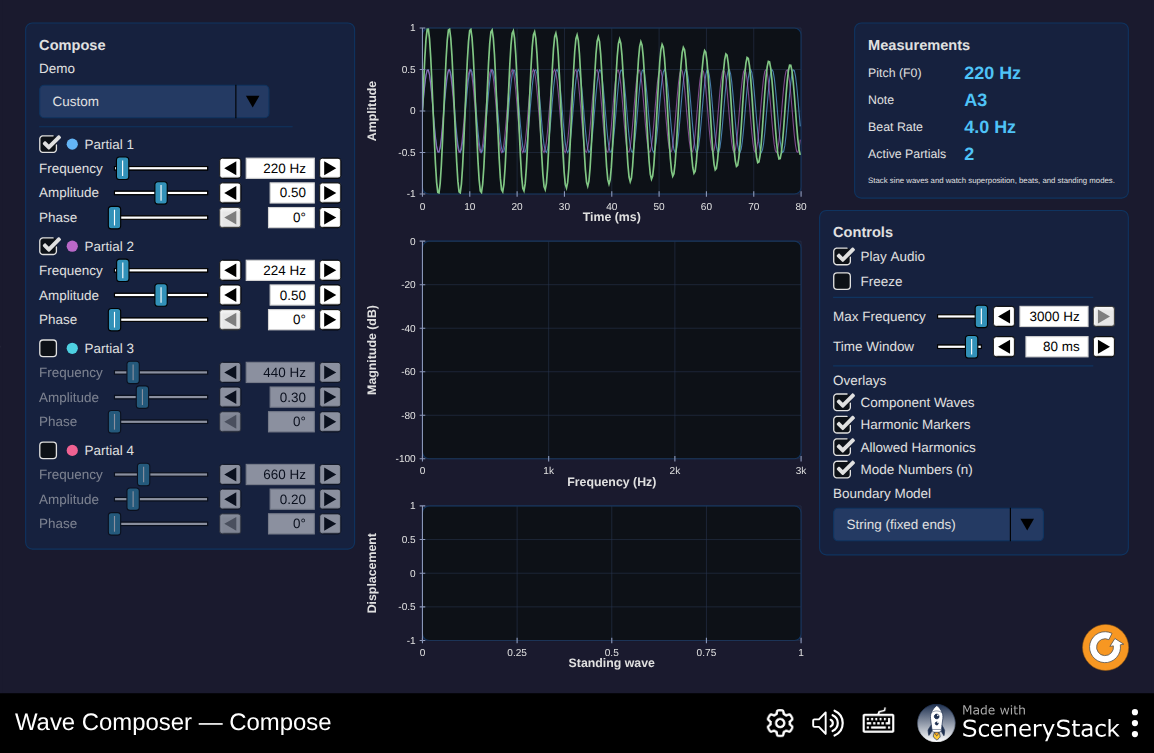
Figure 5.3:The decomposer screen: hand it an arbitrary periodic wave and watch it resolve into a stack of harmonic amplitudes in real time. This is analysis running the other direction from the sawtooth built by hand above, spectrum from waveform rather than waveform from spectrum, and the two screens of this simulation are the theorem’s two directions made concrete.
Interactive simulation: Wave Composer
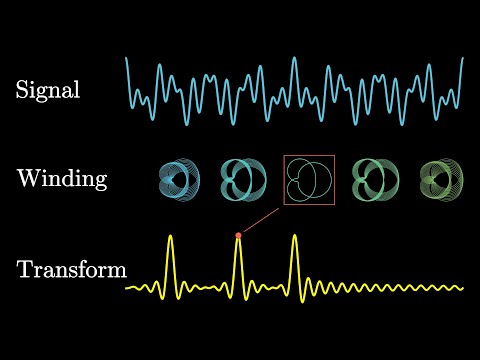
Figure 5.4:Grant Sanderson builds the Fourier transform visually by winding a waveform around a circle. The construction shows how a spectrum measures the amount of each frequency in a signal before the chapter turns to line spectra and timbre.
Watch on YouTube: But What Is the Fourier Transform? A Visual Introduction
5.2The Harmonic Series and the Spectrum¶
Harmonics, Partials, and Overtones¶
Three words, frequently confused, and worth fixing now.
A partial is any frequency component of a complex tone. It is the general word and it carries no assumption.
A harmonic is a partial whose frequency is an exact whole-number multiple of the fundamental. The th harmonic has frequency . The fundamental is the 1st harmonic.
An overtone is any partial above the fundamental. The 1st overtone is the 2nd harmonic.
That last off-by-one is a standing trap, and the reason this book avoids the word “overtone” except when quoting someone who used it.
The distinction between partial and harmonic is not pedantry, because plenty of musical sounds have partials that are not harmonics. A bell, a drum, a cymbal, and, by a small but audible amount, a piano string all produce partials at frequencies that are not whole-number multiples of anything. Section 5.5 and Chapter 12 take those up.
Reading a Line Spectrum¶
A spectrum is conventionally drawn as a line spectrum: a vertical stem at each harmonic, whose height is that harmonic’s amplitude. Stems, not a filled curve, because in a periodic sound there is genuinely nothing between the harmonics, and a filled curve would suggest otherwise.
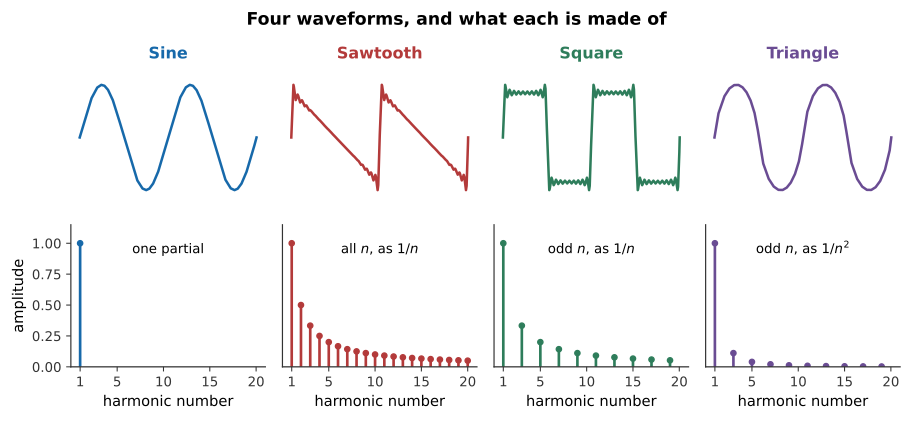
Figure 5.5:Four waveforms and their spectra. The sawtooth contains every harmonic, falling as . The square contains only odd harmonics, also falling as , and sounds hollow, exactly like the stopped pipe of Chapter 3, for exactly the same reason. The triangle contains only odd harmonics but they fall as , which makes it much closer to a sine in character.
The vertical axis is often drawn in decibels rather than linear amplitude, for the reason Chapter 7 will give: the ear’s response is logarithmic, and a partial 40 dB below the fundamental, a hundredth of its amplitude, is still perfectly audible and can matter a great deal to the timbre. On a linear plot it would be invisible.
Why Periodic Means Harmonic¶
Why do the partials of a sustained musical tone come out as exact multiples?
A vibrating string has modes at because of its boundary conditions (Chapter 3). But the deeper reason applies to any sustained tone, whatever produces it: if the waveform repeats exactly, its partials must be exact harmonics, because anything else would prevent the repetition.
This works in reverse too, and it is the key to Chapter 8. When the ear encounters a set of partials at 200, 300, 400, 500 Hz, it can infer that the waveform repeats 100 times a second, and it reports a pitch of 100 Hz, whether or not any energy is present at 100 Hz at all.
5.3Spectrum and Timbre¶
The Same Pitch, Different Sounds¶
Now the chapter’s opening question can be answered. A clarinet and a violin playing the same note differ in their spectra, and that is what you hear.
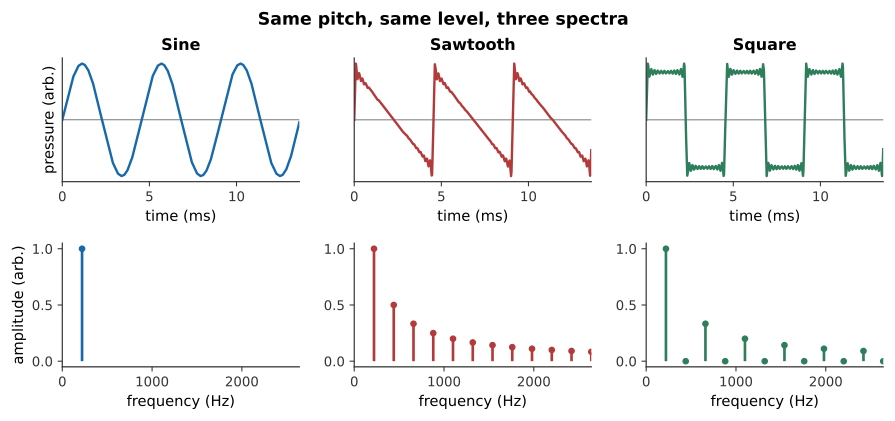
Figure 5.6:The same fundamental, the same loudness, three different sounds. Nothing separates them but which harmonics are present and how strong each one is. This is the whole of the chapter in twelve seconds.
What you hear: Three tones of the same pitch and the same level. The sine is hollow and plain, the sawtooth buzzy and bright, the square hollow but reedy.
Ideal waveforms make the rule clean, but instruments make it musical. The next example holds the performed pitch fixed while changing the entire mechanism that produces and filters it.
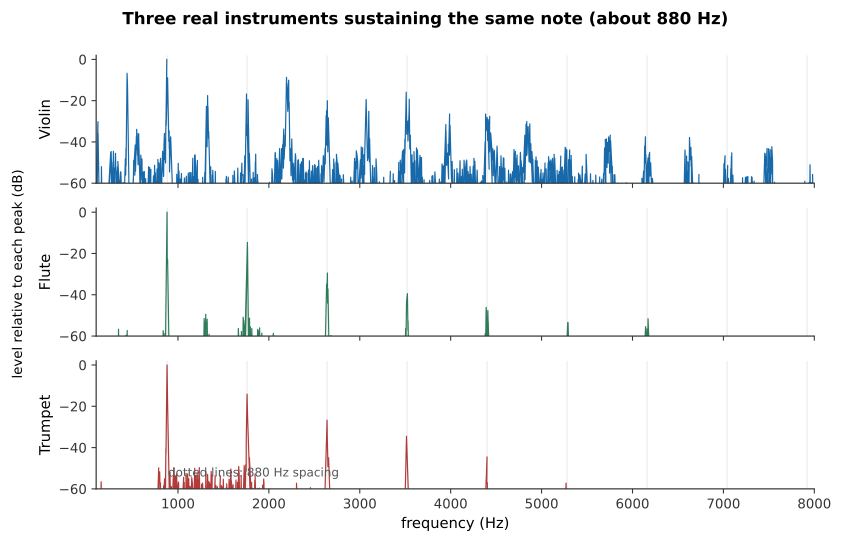
Figure 5.7:Three real instruments, one nominal fundamental near 880 Hz. Their spectral lines share the
same spacing, but their envelopes, noise, attacks, and small performance
fluctuations differ. These CC0 recordings are from the VSCO Community Edition;
the exact source files are recorded in SOURCES.md.
What you hear: Three musicians sustain the same high note. The violin is textured and continuously wavering, the flute is breathy and comparatively pure, and the trumpet is bright and brassy with strong upper harmonics.
Some rough rules connect a spectrum to what it sounds like:
| Spectral feature | Perceived as |
|---|---|
| Strong high harmonics | Bright, brilliant, harsh |
| Harmonics dying quickly | Dark, mellow, round |
| Odd harmonics only | Hollow, woody, reedy |
| Very few harmonics | Pure, thin, flute-like |
| Many closely spaced inharmonic partials | Clangorous, metallic |
The spectral centroid, the amplitude-weighted average frequency of the partials, correlates well with judgments of brightness, and is the single number most often used when a machine has to guess what a sound is like.
Spectral Centroid, Brightness, and Roll-off¶
Two cautions about that correlation, because it is easy to lean on it too hard.
First, the centroid is a summary. Two spectra with the same centroid can sound quite different if one has its energy concentrated in a narrow band and the other spreads it widely.
Second, and more interesting: the ear is much more sensitive to the presence or absence of a harmonic than to its exact level. Removing every even harmonic from a tone, turning a sawtooth into a square, is instantly audible and transforms the character of the sound. Halving the amplitude of the seventh harmonic alone is barely audible at all. The pattern matters more than the precise numbers.
The Phase Question¶
Fourier’s theorem gives each harmonic an amplitude and a phase. What does the phase do?
To the waveform, a great deal. Change the phases and the shape of the wave changes completely.
To the ear, remarkably little.
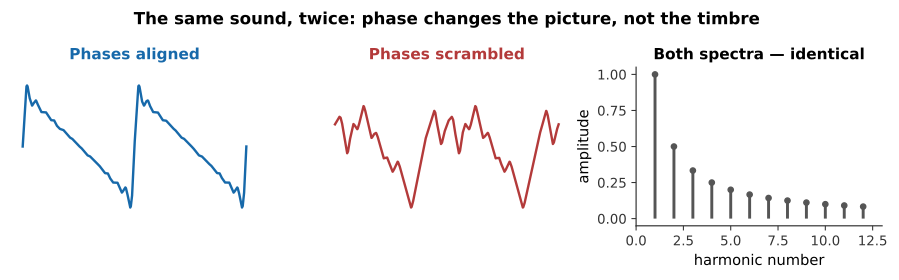
Figure 5.8:Two signals with identical spectra and randomized relative phases. The waveforms look nothing like each other. They sound almost exactly the same.
Figure 5.9:The two signals of the figure above. Try to hear a difference before reading on. This is Ohm’s acoustic law: the ear analyzes a steady sound into its component frequencies and is largely deaf to the phase relationships between them.
What you hear: Two buzzy tones. They are very hard to tell apart, at most there is a slight difference in the quality of the buzz, and many listeners hear none at all.
Listen: Phases aligned, Phases scrambled
This is a genuinely strange fact, and it has two important consequences.
It means the ear is doing something like a Fourier analysis and then discarding half of the result. Chapter 6 shows the mechanism: the cochlea sorts frequencies by place, and place is preserved while relative timing between widely separated frequencies is not.
It also means audio engineers can be relaxed about phase in ways they cannot be about amplitude. A loudspeaker that shifts the phases of different frequencies by different amounts, and all of them do, is not thereby ruining the sound.
5.4Beyond the Steady State¶
Attack, Decay, Sustain, Release¶
Everything so far has assumed a sound that goes on forever. Real notes start and stop, and the way they do it is described by the envelope, conventionally divided into four stages.
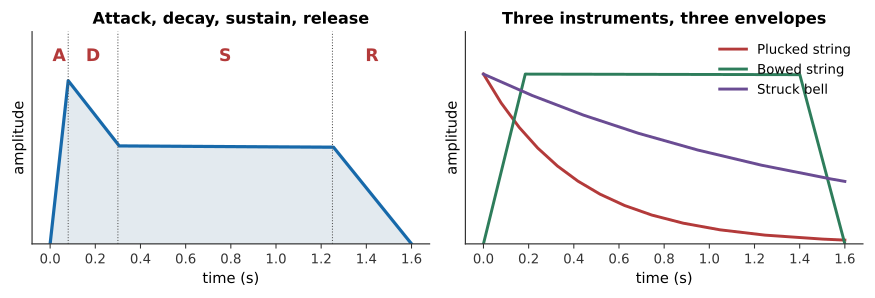
Figure 5.10:Left: the idealized four-stage envelope, borrowed from synthesizer design. Right: three real shapes. A plucked string has essentially no sustain, it starts decaying immediately. A bowed string has no decay at all while the bow keeps moving. A struck bell is a plucked string with a much longer decay.
The envelope alone distinguishes whole families of instrument. Anything struck or plucked must decay, because no energy is being added after the initial event. Anything bowed, blown, or sung can sustain indefinitely, because the player keeps supplying energy. That division, impulsive against sustained excitation, organizes Part V as much as the choice of vibrator does.
Transients Carry the Identity¶
Here is the result that unsettles the neat picture of §5.3.
Record a note on a real instrument. Cut off the first tenth of a second. Play the remainder to a listener and ask them to name the instrument.
They will struggle. Piano, guitar, and bowed notes with their attacks removed are surprisingly easy to confuse, and a piano with its attack removed does not sound much like a piano at all. The steady-state spectrum, the thing this chapter has spent five sections on, turns out to be a weaker cue than the first fraction of a second.
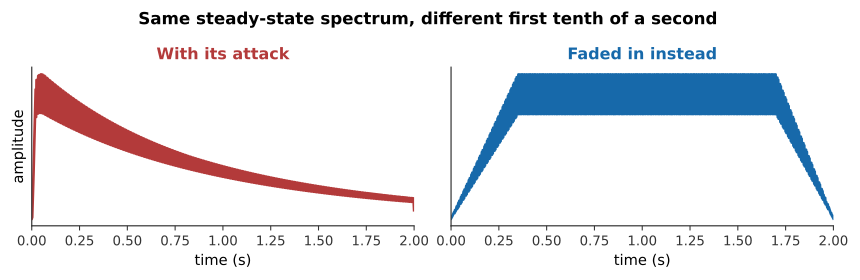
Figure 5.11:The same steady-state spectrum, with and without a struck attack. Nothing about the harmonic content differs. What differs is the first tenth of a second, and it is enough to move the sound into a different instrumental family.
What you hear: Two notes with the same pitch and the same harmonics. The first begins with a sharp, percussive onset and sounds struck; the second fades in smoothly and sounds like an organ or a synthesizer, despite being made of exactly the same partials.
Listen: With its attack, Faded in instead
What is happening in that first tenth of a second? Several things at once: the partials do not all arrive together, they do not all arrive at their final amplitudes, and there is usually a burst of noise: the scrape of a bow catching, the breath of a flute, the thump of a hammer, the click of a key. None of it is periodic, so none of it is in the spectrum, and all of it is informative.
The Spectrogram¶
A single spectrum describes a sound that is not changing. Real sounds change constantly, and the tool for those is the spectrogram: a picture with time across the bottom, frequency up the side, and intensity shown as brightness.
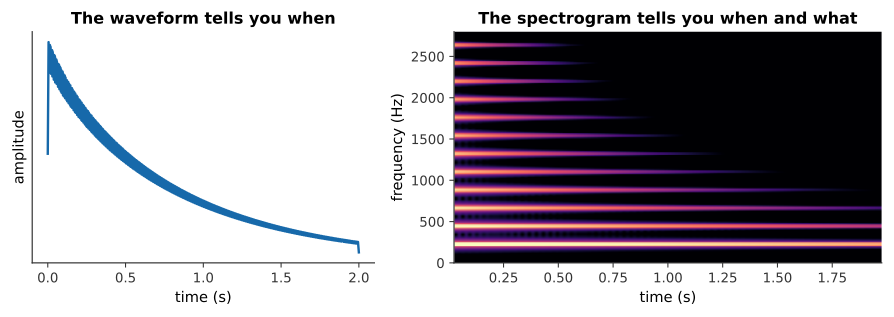
Figure 5.12:A plucked note, twice. The waveform on the left shows when things happen. The spectrogram on the right shows when and what: each horizontal band is a harmonic, and the higher bands fade first. This is the general behavior of struck and plucked instruments, and it is why a note gets darker as it dies away.
The spectrogram is made by chopping the signal into short overlapping windows and taking the spectrum of each. That construction contains an unavoidable trade-off, which Chapter 15 meets again in a different guise: a short window locates events precisely in time but cannot resolve closely spaced frequencies, and a long window does the opposite. You cannot have both, and the choice of window length is the first thing to check when reading someone else’s spectrogram.
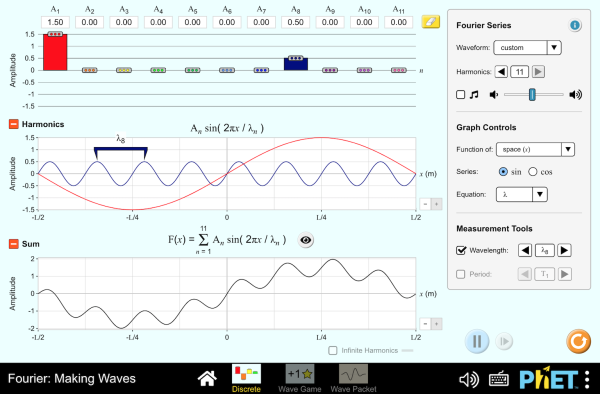
Figure 5.13:Build a waveform by dragging the amplitude of each harmonic and watch the shape respond. Two experiments repay the effort: reproduce the square wave by setting the even harmonics to zero, and then change the phase of a single harmonic and watch the waveform transform while the spectrum does not move at all.
Interactive simulation: Fourier Making Waves
5.5When the Spectrum Is Not Harmonic¶
Inharmonicity¶
A real piano string is not an ideal string. It has stiffness, it resists being bent, not merely being stretched, and stiffness adds a restoring force that grows with curvature. High modes are more curved than low ones, so they are stiffened more, and their frequencies are pushed up:
where is a small inharmonicity coefficient, typically around 10-4 for a piano’s middle register.
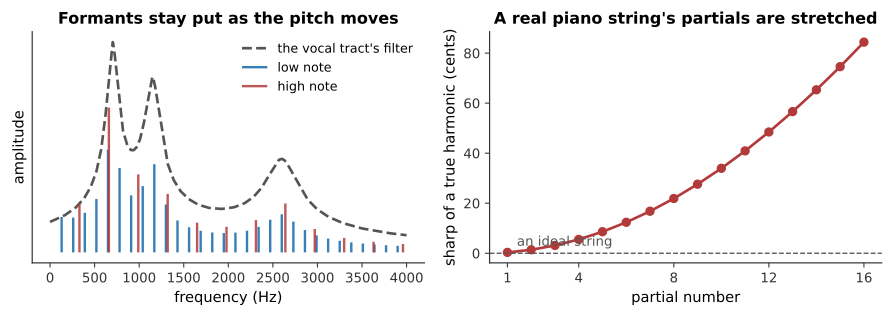
Figure 5.14:Left: formants, resonances fixed by the instrument’s body, which shape whichever harmonics happen to fall near them. Right: inharmonicity, the partials of a real piano string, stretched progressively sharp of exact multiples. By the sixteenth partial the departure is most of a semitone.
The consequence is audible and important: a piano’s octaves must be stretched. If the upper octave were tuned to exactly twice the lower fundamental, it would beat against the lower note’s stretched second partial. Tuners tune the octave to the partial instead, which makes the top of a piano sharp and the bottom flat relative to equal temperament, by as much as 30 cents at the extremes. Chapter 10 works this through.
Formants: Fixed Resonances, Moving Fundamental¶
The left panel of that figure shows the other way a spectrum acquires structure.
So far the spectrum has been described as a property of the source. But every instrument has a resonator (Chapter 4), and the resonator is a filter with its own fixed peaks. Those peaks are formants, and they emphasize whichever harmonics fall near them.
The crucial point is that formants do not move when the pitch does. Sing “ah” on a low note and then a high one: the fundamental changes, the harmonics change, but the resonances of your vocal tract stay where they are, because your throat has not changed shape. That is why the vowel remains recognizable, and it is the entire basis of Chapter 13.
This is the source–filter model of §4.5, now stated spectrally: the source supplies a harmonic series, the filter shapes it, and what you hear is the product. It applies to the voice, to every wind instrument, to a violin body, and to a subtractive synthesizer.
Noise and Its Musical Uses¶
Finally, the sounds Fourier’s theorem does not cover.
A periodic sound has a line spectrum. A sound that never repeats has a continuous spectrum, energy at all frequencies rather than at a discrete set. That is noise, and music is full of it: the breath in a flute tone, the scrape of rosin, the consonants in sung text, the wash of a cymbal, the snares on a snare drum.
Noise is not a defect. Synthesized instruments that get the harmonic spectrum exactly right and leave the noise out sound sterile, and the single most effective improvement to an early digital instrument is usually to put the breath back. What a listener recognizes as “a real flute” is partly the harmonic series and partly the hiss that accompanies it.
There is a continuum here rather than a boundary. A cymbal’s partials are so numerous and so closely spaced that the ear cannot separate them, and hears noise. A slightly unsteady sung note has partials that wander, smearing each line into a band. Chapter 12 works along this continuum from the nearly harmonic to the frankly noisy.
5.6Summary¶
Fourier’s theorem: any periodic waveform is a sum of sinusoids at whole-number multiples of one fundamental frequency, uniquely. Periodicity forces the partials to be exact harmonics.
The spectrum, the list of harmonic amplitudes, is drawn as a line spectrum, because a periodic sound genuinely has nothing between its harmonics. A decibel axis is usually more informative than a linear one.
Sharper waveforms have slower-decaying harmonics. A discontinuity gives , a kink gives . This is why sharp-cornered waveforms sound bright.
Timbre lives in the spectrum: same pitch, same loudness, different harmonic content, different sound. Odd harmonics alone sound hollow; strong high harmonics sound bright; few harmonics sound pure.
Phase changes the waveform but barely changes the sound (Ohm’s acoustic law), for a steady tone. The exceptions are beating partials, binaural cues, and transient-rich material.
The envelope, attack, decay, sustain, release, divides instruments into impulsive and sustained families, and transients carry an instrument’s identity at least as strongly as its steady-state spectrum does. Removing a note’s attack makes it hard to name the instrument.
A spectrogram shows spectrum against time, at the cost of an unavoidable trade-off: short windows resolve time, long windows resolve frequency, and no window does both.
Inharmonicity, caused by string stiffness, stretches a piano’s partials as , which forces stretched tuning.
Formants are the fixed resonances of an instrument’s body. They stay put as the pitch moves, so a vowel stays recognizable across a singer’s range. Source-plus-filter is the model the rest of the book uses.
Noise has a continuous spectrum and is a genuine part of musical sound, not a defect.
5.7Check Your Understanding¶
Five short, auto-graded questions cycle within one compact activity, using five different response styles.
Multiple response. Which statements describe a periodic musical waveform? Consider harmonic spacing, line spectra, phase, and odd versus even harmonics.
True or false. For a steady complex tone, changing only the harmonic phases usually changes the perceived timbre dramatically.
Drag the words. Match a waveform discontinuity and a kink to or spectral falloff, then match short and long analysis windows to time or frequency resolution.
Fill in the blanks. Any periodic waveform can be written as a sum of ___ at whole-number multiples of one ___ frequency.
Mark the words. Identify the four stages of an ADSR envelope: “Attack, decay, sustain, and release describe how a note changes through time; spectral centroid and formants describe its spectrum.”
5.8Conceptual Questions¶
Explain why the partials of a sustained musical tone must be exact whole-number multiples of the fundamental, without referring to any particular instrument.
A square wave and a sawtooth wave at the same pitch sound clearly different. State the difference in their spectra and predict which sounds hollower.
Explain why a waveform with a sharp corner has more high-frequency content than a smooth one.
Two signals have identical spectra but scrambled relative phases, and look completely different on an oscilloscope. Explain why they sound nearly the same, and name one situation in which they would not.
Explain why cutting the first tenth of a second off a recorded piano note makes it difficult to identify the instrument, given that the spectrum of the remainder is unchanged.
A spectrogram of a plucked note shows the upper bands fading before the lower ones. Explain what this says about how the note’s timbre changes as it decays.
Explain what a formant is, and why singing a vowel at a higher pitch does not move it.
A cymbal has a spectrum with no clear lines in it. Explain why it has no definite pitch, and relate your answer to the modes of a plate.
5.9Problems¶
Solution to Exercise 5.1 #
Solution to Exercise 5.2 #
(a) For the sawtooth, .
(b) In decibels, using for an amplitude ratio:
(c) For the triangle, : the 8th harmonic is even and therefore absent. Taking the 7th instead:
Therefore, the sawtooth’s 8th harmonic is 18 dB down and the triangle’s 7th is 34 dB down: the triangle therefore sounds much closer to a pure tone.
Solution to Exercise 5.3 #
(a) The partials are spaced 100 Hz apart and each is a multiple of 100 Hz, so Hz.
(b) They are the 3rd, 4th, 5th, 6th, and 7th harmonics.
(c) No, there is nothing at 100 Hz, and nothing at 200 Hz either.
Therefore, the waveform repeats 100 times a second and a listener hears a pitch of 100 Hz despite the complete absence of energy there. This is the missing fundamental, taken up in Chapter 8.
Solution to Exercise 5.4 #
Using .
(a) For :
against an exact 524 Hz. In cents:
(b) For :
against an exact 2096 Hz:
Therefore, the 2nd partial is sharp by half a cent, inaudible alone, and the 8th by 7 cents, which is easily enough to produce audible beating against another string’s true harmonic. That beating is what forces stretched tuning.
Solution to Exercise 5.5 #
The spectral centroid is the amplitude-weighted mean frequency:
The numerator:
The denominator:
So
Therefore, the centroid is about 438 Hz, roughly the 2nd harmonic. Note the pattern visible in the numerator: with amplitudes falling as , every harmonic contributes equally to the centroid, so spectra sound as bright as they do.
Solution to Exercise 5.6 #
(a) The frequency resolution of a window of duration is roughly :
(b) Yes. The two harmonics are 100 Hz apart, comfortably more than the 22 Hz resolution.
(c) No. The window is 46 ms long, so two events 10 ms apart fall inside the same window and are smeared together.
Therefore, this window is good for frequency and poor for time. Resolving the 10 ms events would need a window under about 10 ms, which would degrade the frequency resolution to roughly 100 Hz, no longer able to separate the harmonics of part (b). This is the trade-off of §5.4, in numbers.
Solution to Exercise 5.7 #
(a) Odd harmonics of 147 Hz: 147, 441, 735, 1029 Hz.
(b) All harmonics: 147, 294, 441, 588 Hz.
(c) The clarinet is missing the octave (294 Hz), the second octave (588 Hz), and every other even partial. The octave above the fundamental is the partial that most reinforces a sense of a full, rounded tone, so removing it leaves the characteristic hollow, woody clarinet sound.
Therefore, the difference is not a matter of degree but of which partials exist at all: the same distinction the stopped and open pipes of Chapter 3 demonstrated.
Solution to Exercise 5.8 #
(a) No. Phase determines how the harmonics line up, and shifting them changes the shape of the sum entirely, often changing the peak amplitude by a factor of two or more.
(b) Essentially yes, for a steady tone. This is Ohm’s acoustic law: the ear analyzes into frequency components and is largely insensitive to the relative phases among them.
(c) Yes. The energy is , which contains no phases at all.
Therefore, the two differ in waveform, agree in energy, and agree in sound, which is only strange if one assumes the ear works on the waveform. It does not; it works on something much closer to the spectrum.
Solution to Exercise 5.9 #
(a) Plucking at puts the pluck at a node of the 7th mode and all its multiples, so harmonics 7, 14, 21, … are absent.
(b) Removing the 7th harmonic is, in this case, desirable rather than accidental. The 7th harmonic is 31 cents flat of any equal-tempered note (Chapter 9) and clashes with the harmonies of common-practice music, so plucking near is a way of suppressing a partial that would otherwise sound out of tune.
Therefore, the pluck point is a spectral design choice rather than an arbitrary one, and the same reasoning explains why piano hammers strike at about of the string length.
Solution to Exercise 5.10 #
(a) At Hz the harmonics are 140, 280, 420, 560, 700, 840, … The 5th harmonic (700 Hz) lands exactly on the first formant; the closest to 1200 Hz is the 9th at 1260 Hz, 60 Hz away.
At Hz the harmonics are 350, 700, 1050, 1400, … The 2nd (700 Hz) lands on the first formant; the closest to 1200 Hz is the 3rd at 1050 Hz or the 4th at 1400 Hz, both 150–200 Hz away.
(b) The low pitch. Its harmonics are spaced 140 Hz apart, so there is nearly always one close to any formant, and the formant peaks are well sampled. At the high pitch the harmonics are 350 Hz apart, and a formant can fall in a gap between them, leaving the ear with no evidence that it is there.
Therefore, the vowel is clearer at the lower pitch: the reason a soprano’s words become hard to make out at the top of her range, and the reason singers modify vowels there (Chapter 13).
Solution to Exercise 5.11 #
The energy of a signal over one period is proportional to the mean of its square:
Expanding the square gives terms of two kinds. The “diagonal” terms are
since the mean square of a sinusoid is whatever its phase. The “cross” terms, with , are
by the orthogonality of §5.1, and this vanishes for any pair of phases.
So
which contains no phases at all.
Therefore, the energy depends only on the amplitudes. This is Parseval’s theorem, and it is the formal statement of why two signals with the same spectrum and different phases are equally loud however different they look.
Solution to Exercise 5.12 #
(a) Using with :
(b) The high partials die far faster than the low ones, so the spectral centroid falls steadily and the note becomes progressively darker and more sine-like as it decays.
Therefore, the timbre of a plucked or struck note is not a fixed property but a moving one, bright at the onset and mellow at the end. This is exactly the behavior visible in the spectrogram of §5.4, and it is one of the things that makes a sustained synthesized tone sound artificial when it is left unchanged throughout.
Solution to Exercise 5.13 #
Three, drawing on this chapter:
A transient onset, partials arriving at slightly different times, with the high ones leading. §5.4 showed that the attack carries more identifying information than the steady spectrum, and a tone that simply switches on has none.
Noise, breath, bow scrape, key click, at the onset and continuing at low level. Noise has a continuous spectrum and so is entirely absent from a purely harmonic synthesis, yet every real instrument produces it.
Time-varying partial amplitudes, high harmonics decaying faster than low ones, and small independent fluctuations in each. A real note’s spectrum is never constant, and Exercise 5.12 showed how much the timbre moves over a single note.
A fourth worth mentioning is slight inharmonicity or slight pitch instability, which smears each spectral line into a narrow band and removes the unnaturally perfect periodicity.
Therefore, what is missing from the sterile tone is precisely everything Fourier’s theorem does not describe: the theorem covers steady periodic sound completely, and real instruments are never quite steady and never quite periodic.
Solution to Exercise 5.14 #
(a) A square wave has odd harmonics only: 150, 450, 750, 1050, 1350, … Hz. Those below 1000 Hz are the 1st, 3rd, and 5th, 150, 450, and 750 Hz.
(b) With only three partials left, the sharp vertical edges disappear. What remains is a rounded, rippling approximation to a square, recognizably square-ish in outline, but with visible oscillation along the flat tops, since three harmonics is far too few to build a corner.
(c) The tone becomes much duller and less reedy. The pitch is unchanged at 150 Hz, because the fundamental and the harmonic spacing are untouched.
Therefore, the filter has changed the timbre substantially while leaving the pitch exactly where it was: a clean separation of the two attributes, and the basic operation of subtractive synthesis (Chapter 15).