Learning Objectives¶
By the end of this chapter, you should be able to:
Distinguish sound pressure, sound intensity, and loudness, and state which are physical and which is perceptual.
Explain why the enormous range of audible intensities makes a logarithmic scale the natural one.
Calculate sound intensity level and sound pressure level in decibels from intensity or pressure, and convert back.
Explain why a factor of ten in intensity is 10 dB and a factor of two is 3 dB, and use those two facts to do decibel arithmetic without a calculator.
Combine the levels of two or more incoherent sources, and explain why doubling the number of violins does not double the loudness.
Distinguish the decibel as a ratio from the decibel as an absolute level referred to a stated reference, and use dB SPL correctly.
Read the equal-loudness contours, define the phon, and explain why bass disappears first when music is played quietly.
Define the sone, use the rule that ten phons doubles the loudness, and explain why a 60-piece orchestra is not sixty times as loud as one instrument.
Explain masking and the critical band, and give a musical consequence of each.
Introduction¶
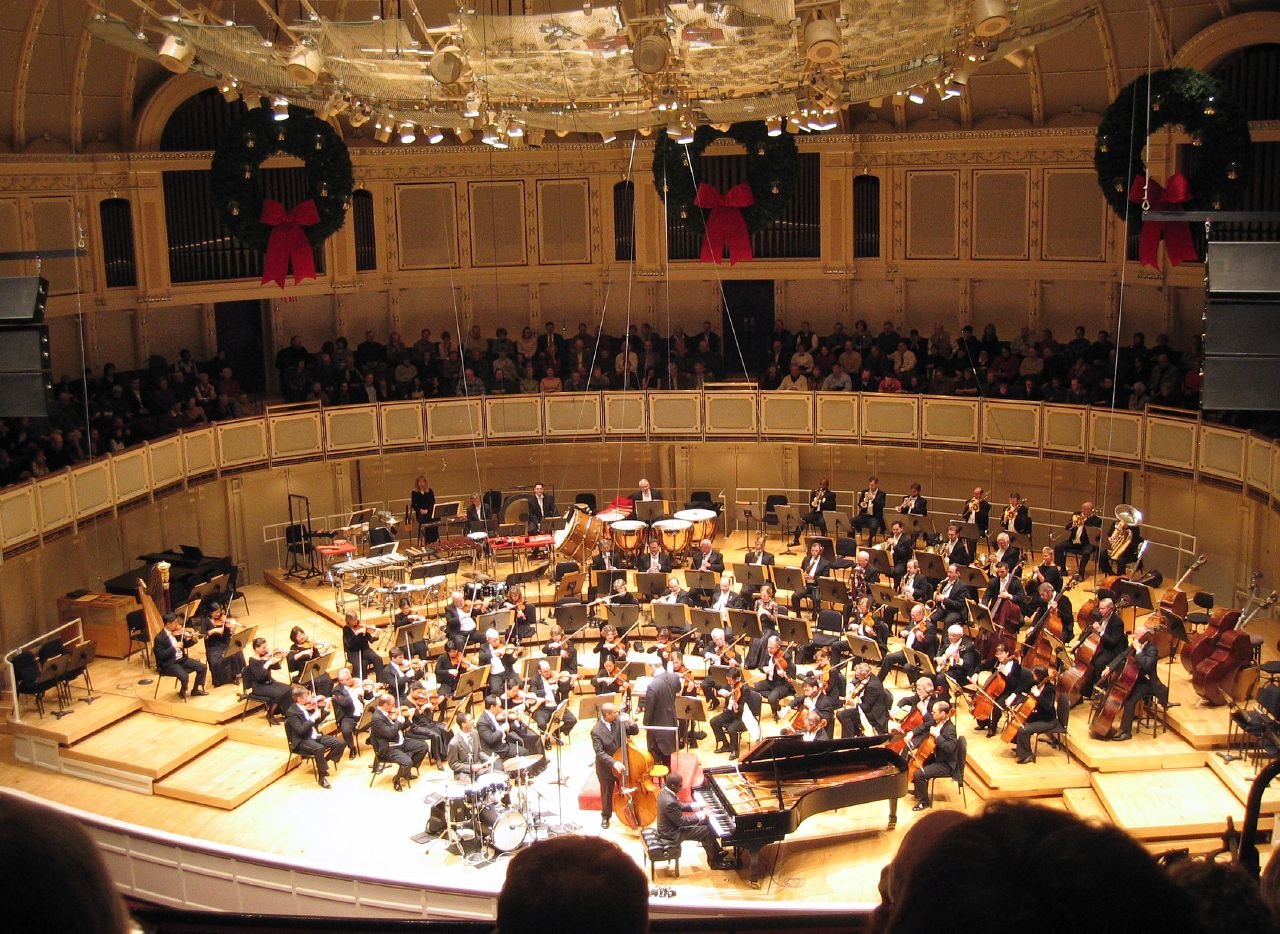
Figure 7.1:Sound level is always measured somewhere. A concert hall makes that “somewhere” consequential: source, distance, reflections, and listener all enter the result. Jordan Fischer, CC BY 2.0.
Turn the volume knob halfway down. Is the music half as loud?
Nobody thinks so, and the reason is the subject of this chapter. Between the sound pressure at your eardrum and the loudness you experience lie two transformations, and neither is a simple proportion.
The first is enormous range. The quietest audible sound and the loudest tolerable one differ in pressure by a factor of about a million, and in energy by a factor of about a million million. No linear scale copes with that, and the decibel exists to tame it.
The second is frequency dependence. The ear is far more sensitive at some frequencies than at others, and, the awkward part, how much more depends on how loud the sound is. A bass note and a mid-range note that match in loudness when played loudly will not match when played quietly. Music therefore sounds thin at low volume, and it is a fact about you rather than about your loudspeakers.
This chapter separates three things that ordinary speech runs together:
| Quantity | What it is | Units |
|---|---|---|
| Sound pressure level | Physical, measurable with an instrument | dB SPL |
| Loudness level | How loud it sounds, expressed as the level of an equally loud 1 kHz tone | phon |
| Loudness | How loud it sounds, on a scale where twice the number means twice as loud | sone |
Only the first is physics in the sense of Chapters 1 to 5. The other two are properties of a listener, and getting from the first to the third is what the chapter does.
7.1Pressure, Intensity, and the Range of Hearing¶
Two Physical Measures¶
Two physical quantities describe the strength of a sound, and both are used.
Sound pressure is the amplitude of the pressure variation, in pascals. It is what a microphone and an eardrum actually respond to.
Intensity is the power per unit area carried by the wave, in watts per square meter. It is related to pressure by
where is the acoustic impedance of the medium, about 413 kg m⁻² s⁻¹ for air at room temperature.
The essential relation is the one Chapter 1 established: intensity goes as the square of pressure. Double the pressure and you quadruple the intensity. Every factor-of-two confusion in acoustics comes from losing track of this.
Twelve Orders of Magnitude¶
The numbers are worth writing out.
| Pressure (Pa) | Intensity (W/m²) | |
|---|---|---|
| Threshold of hearing at 1 kHz | ||
| Quiet conversation | ||
| Orchestra, fortissimo | ||
| Threshold of pain | 20 | 1 |
The pressure range is 106 and the intensity range is 1012. For comparison, the total acoustic power radiated by a full symphony orchestra playing as loudly as it can is somewhere around one watt, less than a small light bulb. The ear is an extraordinarily sensitive instrument working with extraordinarily small quantities.
A linear scale is hopeless here. If one millimeter on a graph represented the threshold of hearing, the threshold of pain would be a thousand kilometers away.
The Reference Values¶
The values in the first row of that table are not accidents; they are definitions, chosen because they are close to the average threshold of hearing at 1 kHz:
Every decibel figure in this book is referred to one of these, and they are consistent with each other: a pressure of in air carries an intensity of very nearly .
7.2The Decibel¶
A Logarithmic Scale¶
The decibel compresses a huge range into a manageable one by taking a logarithm. For a ratio of intensities,
Because intensity goes as pressure squared, and , the same level in terms of pressure is
The factor is 10 for power quantities and 20 for amplitude quantities. They give the same answer for the same physical sound; the difference is entirely in which quantity you started from. Using 10 where you need 20 halves every answer, and it is the most common error in the subject.
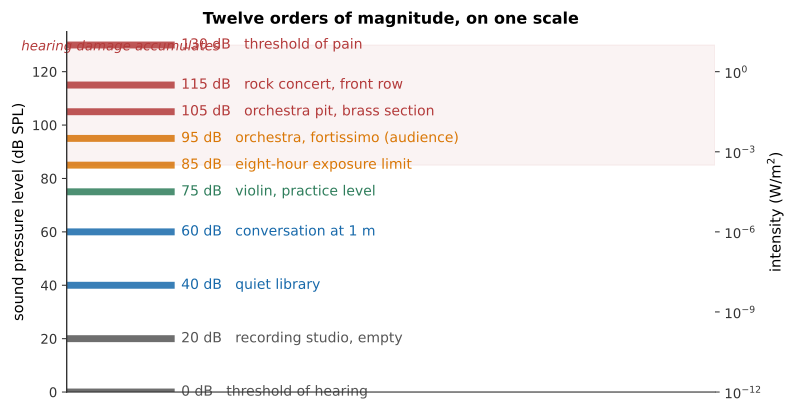
Figure 7.2:The decibel scale, with landmarks. The right-hand axis shows the intensities the same sounds correspond to: each 30 dB is a factor of a thousand. Note how compressed the audible world is on a decibel scale and how spread out it is in watts.
dB SPL and Other References¶
A decibel on its own is a ratio and says nothing absolute. “The passage is 6 dB louder” is meaningful. “The passage is 6 dB” is not, until a reference is stated.
dB SPL means referred to Pa, and is the one used throughout this book for absolute levels. Others exist, dBu and dBV in audio electronics, dBFS in digital audio (Chapter 15), and mixing them up produces errors of tens of decibels.
You will also meet dB A, which is a measurement weighted by a filter approximating the ear’s sensitivity at moderate levels. Exposure limits are quoted in dB A precisely because a sound’s damage potential depends on where its energy lies, not just how much there is.
Decibel Arithmetic Without a Calculator¶
Two facts make most decibel problems mental arithmetic.
The second is approximate, , and the approximation is excellent.
From those two, by adding:
| Intensity ratio | dB | Amplitude ratio | dB | |
|---|---|---|---|---|
| 2 | 3 | 2 | 6 | |
| 4 | 6 | 4 | 12 | |
| 10 | 10 | 10 | 20 | |
| 100 | 20 | 100 | 40 | |
| 1000 | 30 | 1000 | 60 |
Figure 7.3:Khan Academy walks through the logarithmic decibel scale and the meaning of a 10 dB change. The presentation reinforces why multiplication of physical intensity becomes addition on a level scale.
Watch on YouTube: Decibel Scale
7.3Combining and Comparing Levels¶
Adding Incoherent Sources¶
Two violinists play the same note. How much louder than one?
The answer depends on whether their sounds are coherent, locked in a fixed phase relationship, or not.
Two loudspeakers fed from the same signal are coherent, and their pressures add: , which is 6 dB. Two violinists are not coherent: their frequencies and phases drift independently, so the interference at any point averages away over time and their intensities add instead: , which is 3 dB.
Real musicians are incoherent, so for identical independent sources,
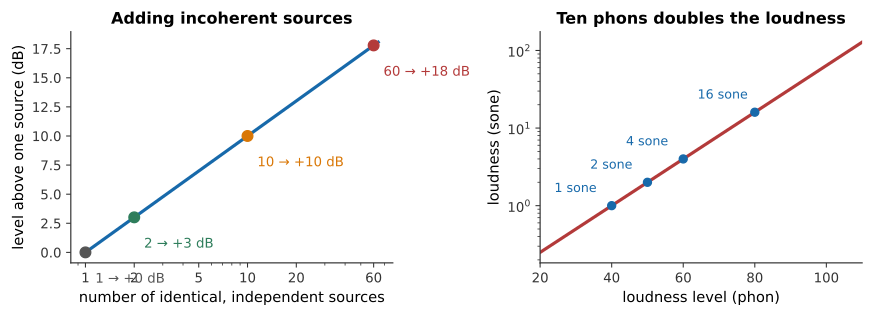
Figure 7.4:Left: adding incoherent sources. Sixty violins are only 18 dB louder than one. Right: loudness in sones against loudness level in phons, each 10 phons doubles the loudness.
The consequence for orchestration is sharp and slightly deflating. Sixty violins produce dB more than one. And since §7.5 will show that 10 phons is a doubling of loudness, 18 dB is under two doublings: sixty violins sound less than four times as loud as one. Orchestras have so many strings and so few trumpets for that reason: the section needs numbers merely to keep up.
Distance, Level, and the Six-Decibel Rule¶
Combining the inverse-square law of Chapter 2 with the definition of the decibel:
Doubling the distance therefore costs dB. Ten times the distance costs 20 dB.
This holds outdoors. Indoors it fails beyond the critical distance, for the reason Chapter 2 gave and Chapter 14 develops: most of what reaches a distant listener has bounced.
Levels of Real Musical Sounds¶
A rough table, for calibration. All at the listener’s position in a concert hall:
| Marking | Level (dB SPL) |
|---|---|
| pp | 50–60 |
| mf | 70–80 |
| ff | 90–100 |
An orchestra’s usable dynamic range is therefore about 40–50 dB, which is far less than the 120 dB the ear can handle. The limit at the bottom is the noise of the hall and the audience; at the top it is what the instruments can produce.
Note also that dynamic markings are not absolute levels. A pianissimo in a Mahler symphony and a pianissimo in a string quartet differ by a good deal, and performers read the marking as an instruction about relative level and character rather than about decibels.
7.4Loudness Level: The Phon¶
Equal-Loudness Contours¶
Now the frequency dependence. The experiment is straightforward to describe: play a 1 kHz reference tone at a known level, then play a tone at some other frequency and ask the listener to adjust it until the two sound equally loud. Repeat across the spectrum, and across reference levels, and average over many listeners.
The result is the set of equal-loudness contours, standardized as ISO 226.
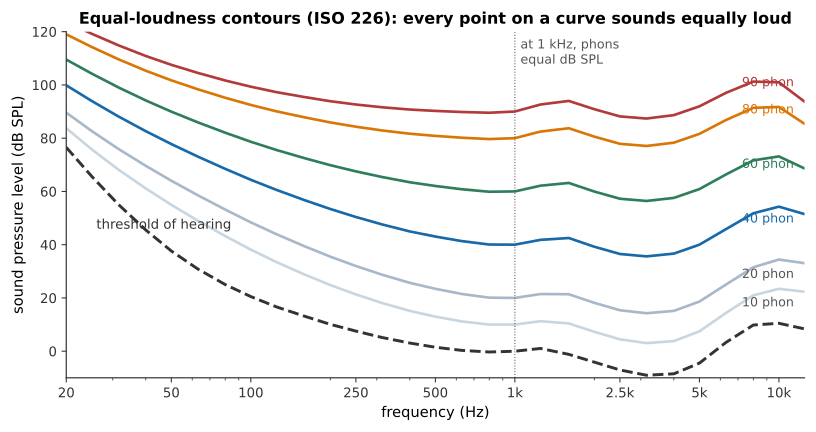
Figure 7.5:The equal-loudness contours. Every point on one curve sounds equally loud. The curves are labeled in phons: by definition, a tone has a loudness level of phons if it sounds as loud as a 1 kHz tone at dB SPL. At 1 kHz, therefore, phons and dB SPL agree exactly; everywhere else they do not.
Three features of those curves carry most of the content.
The ear is most sensitive around 3–4 kHz. This is the ear-canal resonance of Chapter 6, and it is why that region is where speech intelligibility lives and where a singer must compete (Chapter 13).
Sensitivity falls sharply at low frequencies. At 50 Hz the threshold is about 45 dB SPL: a sound 45 dB above the 1 kHz threshold is only just audible.
The curves flatten as level rises. This is the important one, and it is the subject of the next subsection.
Reading the Contours¶
The phon is defined by those curves: a sound has a loudness level of phons if it is judged as loud as a 1 kHz tone at dB SPL.
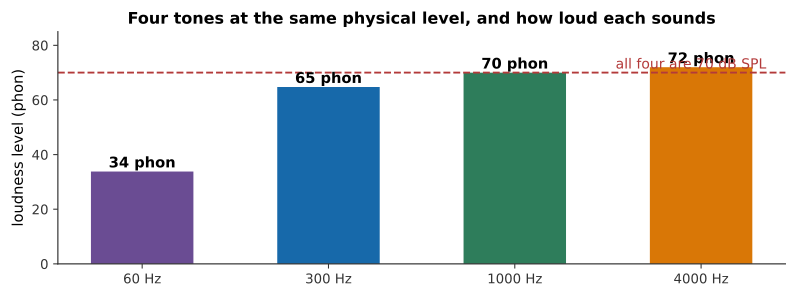
Figure 7.6:Four tones, all at the same sound pressure level, rising in frequency. They are emphatically not equally loud, the 60 Hz tone sounds around 34 phon while the 4 kHz tone sounds around 72 phon, a difference of nearly four doublings in loudness for identical physical sound. (Judge this at a moderate volume; the effect depends on level, which is exactly the point.)
What you hear: Four tones in succession at identical physical level. The first, at 60 Hz, is faint; the second louder; the third and fourth clearly the loudest. They are the same level throughout.
Listen: Equal Amplitude Tones
Why Quiet Music Loses Its Bass¶
Because the contours are not parallel, the ear’s frequency response depends on level.
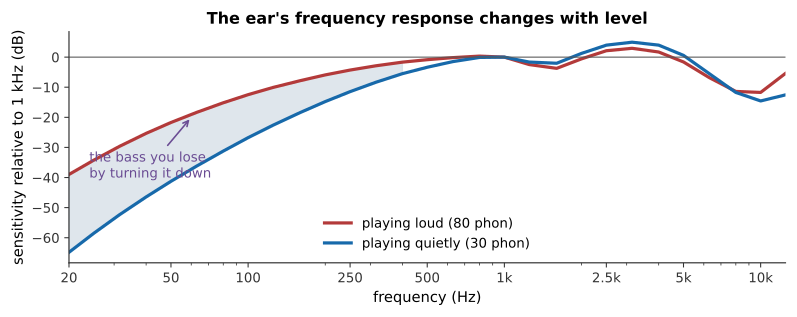
Figure 7.7:The same music, played loudly and quietly, relative to 1 kHz. Turning the volume down does not scale everything equally: the low frequencies fall away faster than the middle, because the contours crowd together at low levels.
The consequence is familiar to everyone. Music played quietly sounds thin. Turning the volume down does not merely make everything smaller; it changes the balance, taking the bass first.
7.5Loudness Itself: The Sone¶
Doubling Loudness¶
The phon says when two sounds are equally loud. It does not say when one is twice as loud, and it cannot: phons are defined by a matching procedure, and matching says nothing about ratios.
To get ratios, ask listeners directly: adjust this sound until it is twice as loud as that one. The answer, robustly reproduced, is
The sone encodes this. One sone is defined as 40 phons, and
with in sones and in phons. So 40 phons is 1 sone, 50 phons is 2 sones, 60 phons is 4 sones.
Ten phons is a factor of ten in intensity. So a tenfold increase in intensity is only a doubling in loudness, which is the compression that makes the ear’s enormous range usable.
Masking¶
A sound that would be perfectly audible on its own can be rendered completely inaudible by another sound. This is masking, and Chapter 6 supplied the mechanism: a masker’s traveling wave excites a region of the basilar membrane, and anything whose own region falls inside that excitation is lost in it.
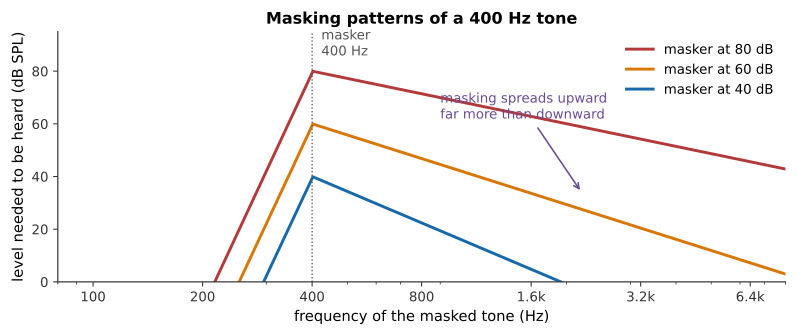
Figure 7.8:Masking patterns produced by a 400 Hz tone. Each curve shows the level another tone needs in order to be heard. Two features matter: masking is asymmetric, spreading far further upward in frequency than downward, and the asymmetry gets worse as the masker gets louder.
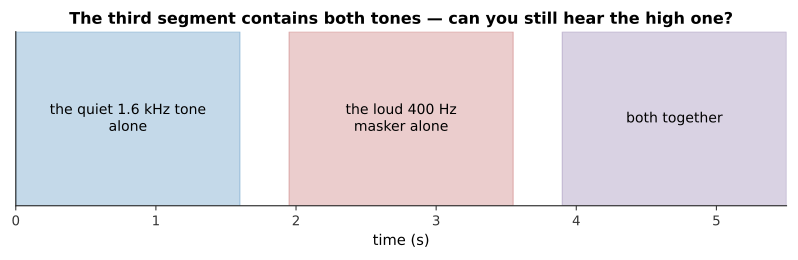
Figure 7.9:Masking in three segments. The high tone in the third segment is present at exactly the level it had in the first. Nothing has been removed from the signal; it has been removed from your perception of it.
What you hear: A quiet high tone, clearly audible on its own. Then a loud low tone. Then both together, in which the high tone has become difficult or impossible to hear.
Listen: Masking Demo
The upward spread of masking has direct musical consequences. A loud bass line buries a quiet high part far more than the reverse, so arrangers give the melody to a high instrument and a mix engineer who wants to hear the hi-hat turns the bass down rather than the hi-hat up.
It is also, remarkably, what makes MP3 possible. If a component of a signal is masked, a listener cannot hear it, so a codec can simply discard it and spend the saved bits elsewhere. Chapter 15 develops this.
The Critical Band¶
Masking is strongest when masker and masked are close in frequency, and the width of the region over which they interact strongly is the critical band.
It is roughly 100 Hz wide below 500 Hz, and roughly a third of an octave above that, which means it is approximately constant in musical terms, a little wider than a major third, across most of the range. That is not a coincidence: the critical band corresponds to a roughly constant distance along the basilar membrane, and Chapter 6 showed that the membrane’s map is logarithmic.
The critical band is the ear’s frequency-resolution limit, and it does a great deal of work in what follows:
Two tones within a critical band interfere audibly and sound rough; two tones further apart do not. This is the physical basis of dissonance (Chapter 8).
Noise masks a tone only if the noise lies within about a critical band of it.
Loudness adds differently within and across critical bands. Spread the same energy across several bands and it sounds louder than if it is concentrated in one; so a chord is louder than a single note of the same total intensity, and a full orchestration carries further than a doubled unison.
7.6Summary¶
Intensity goes as pressure squared. The decibel therefore has two forms: for intensity and power, for pressure and amplitude. They describe the same sound.
Hearing spans 1012 in intensity, from 10-12 W/m² to about 1 W/m², referred to Pa. A decibel figure without a stated reference is a ratio, not a level.
Two facts do most decibel arithmetic: a factor of ten is 10 dB, a factor of two is 3 dB (in intensity).
Incoherent sources add in intensity, so of them give dB. Sixty violins are 18 dB above one, less than four times as loud.
Distance costs 6 dB per doubling outdoors, and much less than that indoors beyond the critical distance.
Equal-loudness contours describe the ear’s frequency dependence. The phon is defined by matching against a 1 kHz tone, so phons and dB SPL agree at 1 kHz and nowhere else. Sensitivity peaks near 3–4 kHz and collapses at low frequencies.
The contours flatten as level rises, so the ear’s frequency balance depends on volume. Quiet music loses its bass first.
The sone measures loudness itself: 1 sone is 40 phons, and each 10 phons doubles it. A tenfold increase in intensity is a twofold increase in loudness.
Masking renders an audible sound inaudible, spreading much further upward in frequency than downward. It is the basis of perceptual audio coding.
The critical band is the ear’s resolution limit, roughly a third of an octave, hence roughly constant in musical terms. It underlies roughness, dissonance, and the way loudness sums across a spectrum.
7.7Check Your Understanding¶
Five short, auto-graded questions cycle within one compact activity, using five different response styles.
Multiple choice. Eight identical, mutually incoherent sources play together. Approximately how much higher is their combined level than one source: 3, 8, 9, or 18 dB?
True or false. Doubling sound-pressure amplitude increases sound-pressure level by about 6 dB.
Drag the words. Complete the rules connecting one sone to phons, a loudness doubling to phons, an outdoor distance doubling to dB, and a doubling of incoherent sources to dB.
Fill in the blanks. Use ___ for pressure or amplitude ratios, but ___ for intensity or power ratios.
Mark the words. Identify the two ideas explaining why quiet playback loses bass: “At low levels the ear is less sensitive to low frequencies, and equal-loudness contours flatten as the overall level rises.”
7.8Conceptual Questions¶
Explain why the decibel scale uses for intensity and for pressure, and why both give the same level for the same sound.
A student writes “the sound was 70 dB”. Explain what is missing from this statement and why it matters.
Explain why two loudspeakers fed from the same signal give +6 dB while two violinists playing the same note give +3 dB.
An orchestra has sixty violins and three trumpets. Use the addition rule to comment on whether this is a sensible balance.
Explain why music played quietly sounds thin, using the shape and spacing of the equal-loudness contours.
A 50 Hz tone and a 3 kHz tone are played at the same dB SPL. Which sounds louder, and roughly by how many phons at moderate levels?
Explain why a loud bass line masks a quiet cymbal much more than a quiet cymbal masks a loud bass line.
Explain how masking allows an audio codec to discard part of a signal without an audible change, and state what would go wrong if the codec’s model of masking were inaccurate.
7.9Problems¶
Solution to Exercise 7.1 #
Solution to Exercise 7.2 #
Using dB and dB.
(a) dB.
(b) dB.
(c) dB.
(d) dB.
Therefore: 20, 9, 16, and -3 dB. (Exact values: 20.0, 9.03, 16.02, -3.01.)
Solution to Exercise 7.3 #
(a) Four incoherent sources add dB:
(b) A rise of 10 dB needs
(c) Ten clarinets for 10 dB, which is one doubling of loudness. Getting a second doubling would take a hundred. An ensemble cannot get much louder by recruiting, so composers reach for instruments with intrinsically higher output, brass, rather than for more of the same.
Solution to Exercise 7.4 #
Using .
(a) dB.
(b) dB.
(c) dB.
Therefore, 82, 70, and 54 dB. At 50 m outdoors the singer is at about the level of a quiet conversation, outdoor performance essentially requires amplification; indoor performance does not.
Solution to Exercise 7.5 #
(a) The loudness level is defined by the 1 kHz match, so both are 30 phons.
(b) The level difference is dB, so the intensity ratio is
Therefore, the 100 Hz tone must be a hundred times more intense to sound equally loud. This is exactly the message of the equal-loudness contours: physical equality and perceptual equality are different things.
Solution to Exercise 7.6 #
(a) Using :
(b) Twice as loud is 16 sones, which is 24, so phons.
(c) Four times is 32 sones, 25, so phons.
Therefore, 8 sones; doubling needs +10 phons and quadrupling +20. Note that quadrupling the loudness requires a hundredfold increase in intensity.
Solution to Exercise 7.7 #
(a) The difference is dB:
(b) 27 dB is nine steps of 3 dB, so nine halvings of eight hours:
Therefore, the sound is about 500 times more intense than the limit, and the safe unprotected exposure is under a minute. A three-hour concert at that level is roughly two hundred times the permitted daily dose.
Solution to Exercise 7.8 #
Intensities add, so convert, add, and convert back.
(a) Relative to : and . The sum is , so
(b) and . The sum is :
(c) A sound 10 dB below another adds almost nothing, less than half a decibel. Anything more than about 10 dB down can usually be ignored when adding levels, which is a useful shortcut and also the reason a single loud instrument can dominate an ensemble entirely.
Solution to Exercise 7.9 #
(a) sones; sones.
(b) The loudness ratio is .
(c) The intensity ratio is .
Therefore, a sound over three thousand times more intense sounds about eleven times louder. The compression is enormous, roughly a cube root, and it is what allows a single dynamic range to accommodate both a solo flute and a full orchestra.
Solution to Exercise 7.10 #
A third of an octave is a frequency ratio of .
(a) A band centered on 1 kHz running from to :
a width of 231 Hz.
(b) The same fractional width at 4 kHz gives 3565 to 4487 Hz, a width of 922 Hz.
(c) A third of an octave is four semitones in both cases, since the band is defined as a fixed ratio.
Therefore, the critical band is four times wider in hertz at 4 kHz than at 1 kHz, but identical in musical terms: a major third. That constancy in musical units is what makes the critical band useful for explaining consonance (Chapter 8).
Solution to Exercise 7.11 #
Incoherent. The phases are uncorrelated, so the cross terms in the squared sum average to zero over time, and the intensities add: . The level rise is
Coherent. The phases are locked, so the pressures add: . Since intensity goes as pressure squared, , and
Therefore, coherent addition gives exactly twice the decibel rise of incoherent addition. For that is 6 dB against 3 dB: the difference between two loudspeakers and two violinists.
The coherent result cannot hold everywhere in space: constructive interference at one point must be paid for by destructive interference elsewhere (Chapter 3). The 6 dB applies on the axis where the two arrive in step.
Solution to Exercise 7.12 #
Reading the contours of Figure 7.5 at 70 dB SPL:
At 60 Hz the 70 dB point lies near the 35 phon contour. At 3 kHz it lies a little above the 70 phon contour, call it 75 phon, since the ear is more sensitive than at 1 kHz there.
In sones:
The ratio is .
Therefore, two sounds of identical physical level differ by a factor of about sixteen in loudness, four doublings. Any claim about how loud something “is”, made without reference to its frequency content, is close to meaningless.
Solution to Exercise 7.13 #
(a) Intensity: .
(b) Pressure: .
(c) Loudness: 3 dB is 0.3 of a 10-phon doubling, so
about a increase.
(d) None of them explicitly, but (c) is the one that matters. A 3 dB boost doubles the energy and is barely a noticeable change in loudness, so mixing moves are typically made in steps of 1 to 3 dB and the smallest audible change in a mix context is often quoted as about 1 dB.
Solution to Exercise 7.14 #
(a) Relative to : flute , noise . Sum :
(b) The signal-to-noise ratio is dB.
(c) With noise at 42 dB: . Sum with the flute: , so dB, essentially unchanged.
The signal-to-noise ratio, however, falls to dB.
Therefore, the audience has not made the hall measurably louder but has removed 12 dB of the flutist’s headroom. The quietest passages the player could previously shape are now within a few decibels of the noise floor and cease to be audible as music. Halls are built with such low background-noise specifications for that reason, and a pianissimo is the first thing a noisy audience destroys.