Learning Objectives
By the end of this chapter, you should be able to:
Name the principal structures of the outer, middle, and inner ear and state the function of each.
Explain how the shape of the pinna and the resonance of the ear canal shape the sound reaching the eardrum, and relate the canal resonance to the region of greatest sensitivity.
Explain the impedance-matching problem between air and the fluid of the cochlea, and calculate the pressure gain the middle ear achieves through the area ratio and the ossicular lever.
Describe the structure of the cochlea and the traveling wave on the basilar membrane.
State the place principle, and use the tonotopic map to predict where a given frequency produces its maximum response.
Describe how hair cells transduce mechanical motion into neural signals, and distinguish the roles of inner and outer hair cells.
Explain phase locking and the volley principle, and state the frequency range over which timing information is available to the auditory nerve.
Explain how excessive sound exposure damages hearing, why the damage is permanent, and what the exposure limits are.
Explain why hair-cell damage can produce tinnitus, a phantom sound, rather than simple silence at the affected frequency.
Introduction
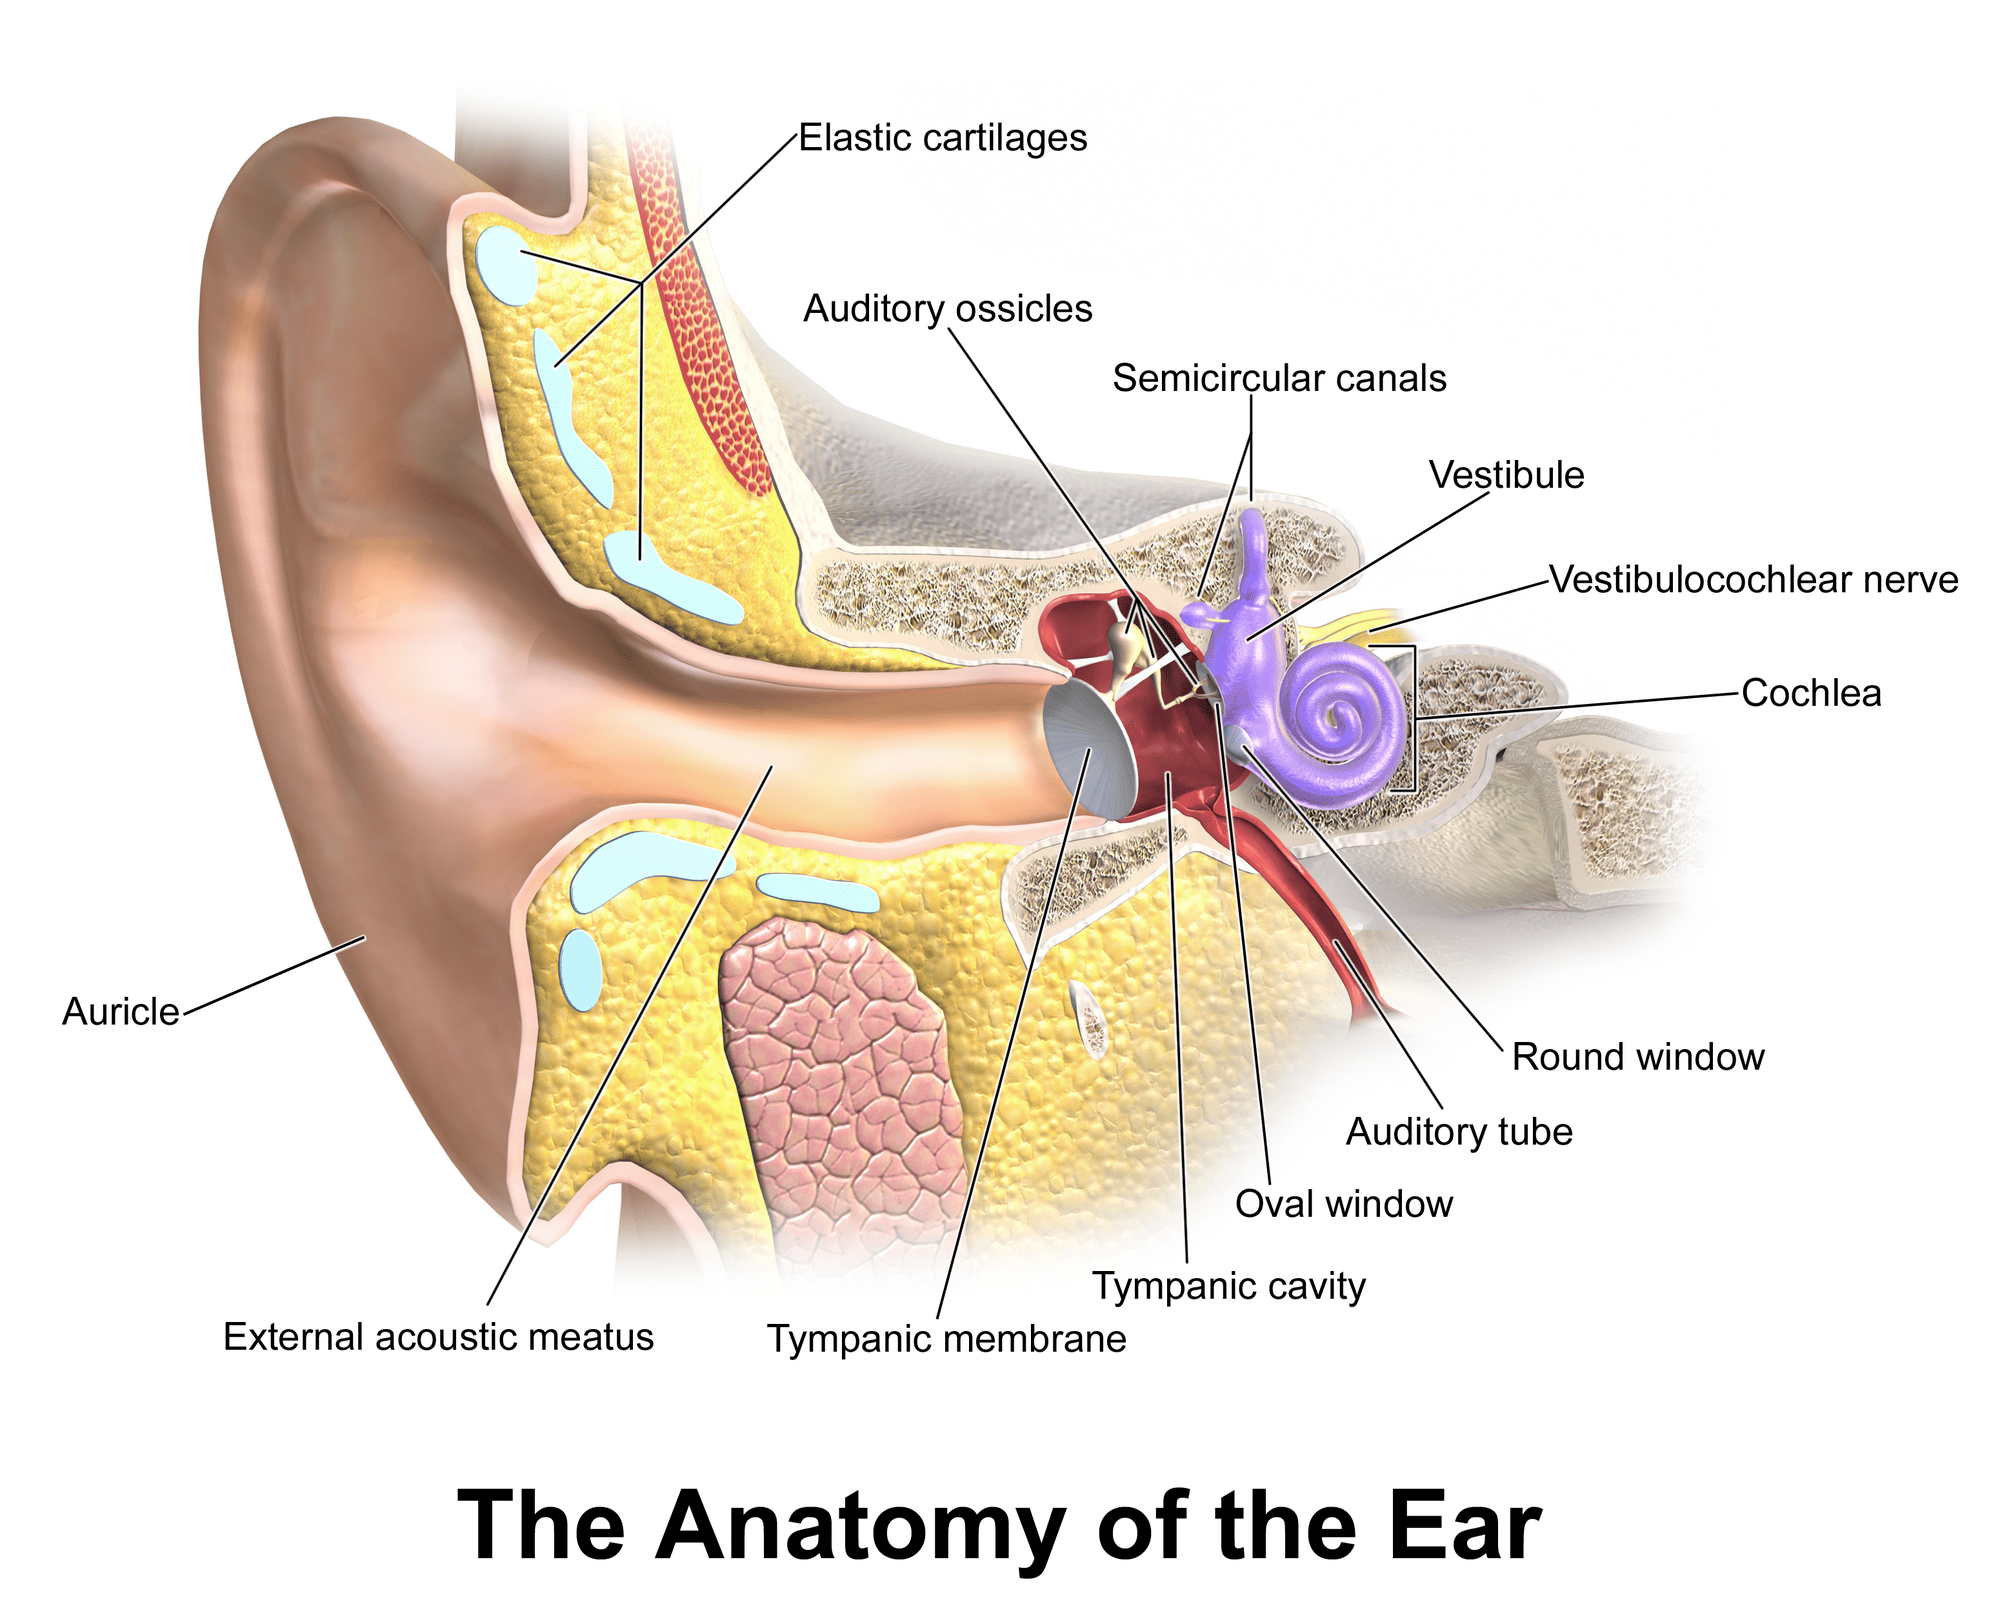
Figure 6.1:The ear is both anatomy and an acoustic pathway. This illustration gives the reader a physical object to keep in mind while the chapter develops its transduction model. BruceBlaus / Blausen Medical, CC BY 3.0.
The book now turns around. Chapters 1 to 5 followed sound from a vibrating object out into the room. The next three follow it from the room into a listener, and the story changes character completely.
Up to this point everything has been measurable with instruments. A microphone and an oscilloscope can tell you the frequency, the amplitude, and the spectrum of a sound, and two competent experimenters will agree on all three. From here on, the quantities are judgments: how loud something seems, how high it seems, whether two notes seem to go together. No instrument measures those. They are produced by a listener, and to understand them you have to understand the machinery that produces them.
That machinery begins with a mechanical problem that is worth appreciating before any biology appears. Sound in air must be transferred into fluid, and Chapter 2 showed that a boundary between media of very different acoustic impedance reflects almost everything. Air to water reflects about of the incident energy: a loss of some 30 dB. An ear made simply of a membrane over a fluid-filled cavity would be nearly deaf.
The middle ear exists to solve exactly that problem, and it recovers almost all of the 30 dB. The rest of the chapter is about what the inner ear does with the sound once it has got it: how it separates frequencies, how it turns motion into nerve impulses, and what its limits are.

Figure 6.2:TED-Ed and Douglas L. Oliver give an anatomical overview of hearing, following a sound from the outer ear through the ossicles and cochlea. It provides a visual map for the structures examined separately below.
Watch on YouTube: The Science of Hearing
6.1The Outer Ear
The Pinna and Direction
The visible ear, the pinna, is a collecting funnel, but that is the least interesting thing about it. Its folds and ridges are not decorative. They reflect incoming sound with small delays that depend on the direction it came from, and those delays reinforce some frequencies and cancel others.
The result is that the spectrum arriving at your eardrum is stamped with a direction-dependent pattern. A sound from above is filtered differently from one in front, which is differently from one behind.
This is the only cue available for distinguishing front from back, or up from down. The two-eared cues, a sound reaching one ear sooner and louder than the other, locate sound left and right very well, but they are identical for a source in front and the same source directly behind. The pinna breaks that ambiguity, and it is why a recording made with microphones in a dummy head’s ears can produce a startlingly convincing sense of height and behindness through headphones (Chapter 15).
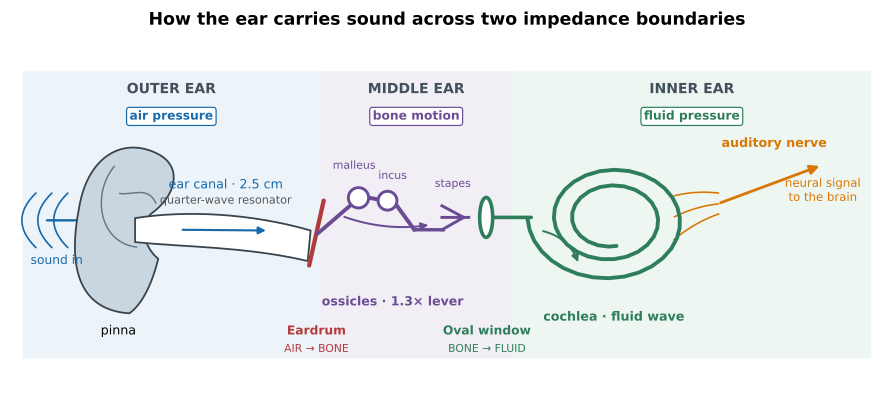
Figure 6.3:The ear, drawn for the argument rather than as an anatomy plate. Arrows follow one continuous signal path through air, bone, fluid, and finally the auditory nerve. The two changes of medium, at the eardrum and oval window, are where the interesting physics happens.
The Ear Canal as a Resonator
The ear canal is a tube about 25 mm long, closed at the far end by the eardrum. That is a stopped pipe, and Chapter 3 gives its fundamental resonance immediately:
The canal therefore boosts sounds near 3–4 kHz by about 10 dB before they reach the eardrum at all.
This is not a coincidence, and it is a genuinely satisfying piece of physics. The region of greatest hearing sensitivity is at 3–4 kHz, and a good part of the reason is a quarter-wave resonance in a 2.5 cm tube. It is also the region of the consonants that carry most of the intelligibility of speech, and the region in which a singer’s voice must compete with an orchestra (Chapter 13).
The Eardrum
The eardrum is a thin conical membrane, about 55 mm² in area, that moves when the pressure in front of it differs from the pressure behind. Its displacement at the threshold of hearing is astonishing: roughly 10-11 m, about a tenth the diameter of a hydrogen atom, and considerably less than the thermal jiggling of the membrane’s own molecules.
That the ear works at all at such amplitudes is possible because it averages over time and area, and because it is not actually detecting a displacement below the thermal noise, it is detecting a correlated displacement against an uncorrelated background. Hearing sits very close to the physical limit of what a detector in a warm, noisy body could achieve.
6.2The Middle Ear
Three Bones and a Lever
Behind the eardrum is an air-filled cavity containing the three smallest bones in the body: the malleus, incus, and stapes, or hammer, anvil, and stirrup. They form a chain from the eardrum to the oval window, the membrane-covered opening into the fluid-filled cochlea.
The chain is a lever. The hammer’s arm is slightly longer than the anvil’s, so the force at the stirrup is about 1.3 times the force at the eardrum, at 1.3 times less displacement.
Impedance Matching by Area Ratio
The lever is the smaller half of the trick. The larger half is area.
The eardrum has an area of about 55 mm²; the oval window has an area of about 3.2 mm². The whole force collected over the eardrum is delivered to the much smaller oval window, and pressure is force over area, so the pressure is multiplied by the ratio of the areas, about 17.
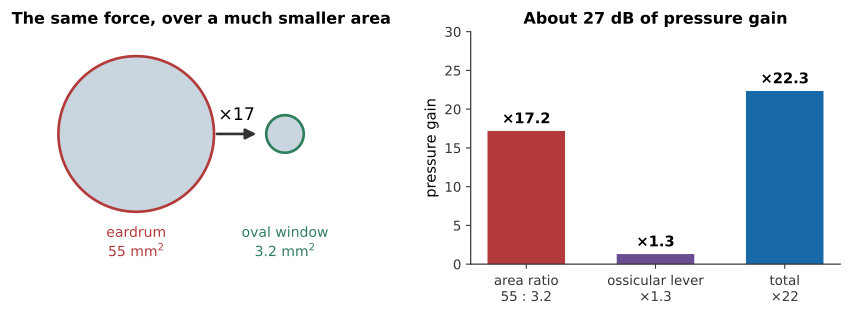
Figure 6.4:Where the middle ear’s gain comes from. The area ratio does most of the work; the ossicular lever adds a little more. Together they multiply the pressure by about 22, which is 27 dB, close to the 30 dB that would otherwise be lost at the air–fluid boundary.
The total pressure gain is about , or 27 dB. Set against the 30 dB that a bare air–fluid boundary would lose, the middle ear recovers all but a few decibels of what would otherwise be thrown away.
The Acoustic Reflex
The middle ear is not a passive lever. Two small muscles, the tensor tympani and the stapedius, contract in response to loud sound, stiffening the chain and reducing its transmission by up to 20 dB at low frequencies.
It is a protection mechanism, and it has two limitations worth knowing, because both bear on musicians. It takes 50–100 ms to engage, so it offers no protection at all against a gunshot or a snare hit. And it fatigues, so it does not protect against sustained loud sound either. The reflex is good at conversation-level fluctuations and useless against the two things that actually damage hearing.
6.3The Cochlea
Anatomy of a Coiled Tube
The cochlea is a fluid-filled tube about 35 mm long, coiled into two and a half turns: the coiling is a packing convenience and has no acoustic significance. Running along its length is the basilar membrane, and the membrane’s properties change systematically from one end to the other:
At the base, near the oval window, it is narrow (about 0.1 mm) and stiff.
At the apex, the far end, it is wide (about 0.5 mm) and floppy.
Narrow and stiff means a high natural frequency; wide and floppy means a low one, exactly as Chapter 1 would predict for anything on a spring. The membrane is therefore a continuous graded series of resonators, running from about 20 kHz at the base to about 20 Hz at the apex.
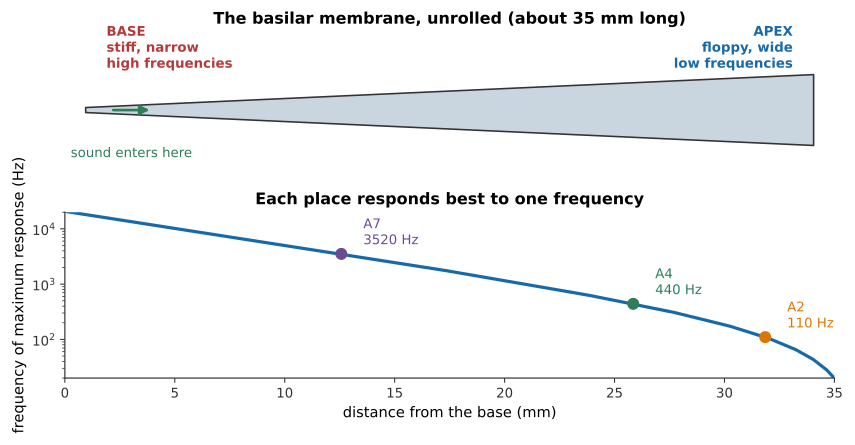
Figure 6.5:The basilar membrane unrolled, and the map of frequency onto place. The frequency axis is logarithmic and the distance axis is linear, and the relationship is close to a straight line, which means equal musical intervals occupy equal distances along the cochlea. An octave is about 3.5 mm, anywhere in the middle of the range.
That last observation is worth dwelling on. The cochlea is laid out logarithmically in frequency, which is the same way music is laid out. The octave is the same physical distance whether it is the octave above middle C or three octaves higher. Much of Chapter 8 follows from this one fact.
The Traveling Wave on the Basilar Membrane
Georg von Békésy won the 1961 Nobel Prize for working out what actually happens in there, and the answer is subtler than “each place resonates”.
A sound entering at the oval window sets off a traveling wave that moves along the membrane from base toward apex. As it travels it grows, reaches a peak at the place matched to its frequency, and then dies away very rapidly.
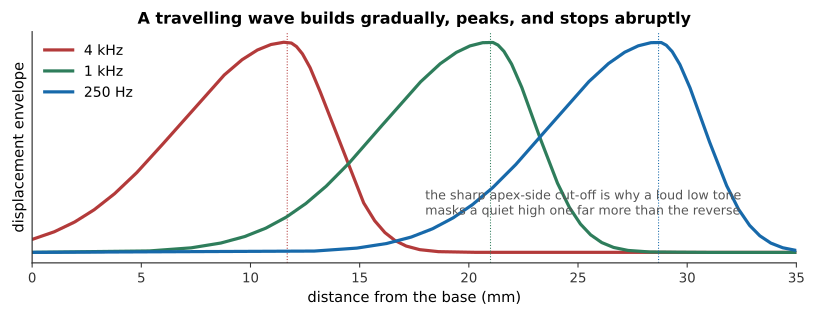
Figure 6.6:Envelopes of the traveling wave at three frequencies. Each rises gradually and falls steeply. The asymmetry is not cosmetic: a low-frequency wave travels the whole length of the membrane and excites everything on the way, while a high-frequency wave never reaches the apex at all.
The asymmetry of those envelopes has a direct musical consequence, and it is one of the few places where anatomy explains something a listener notices. A loud low tone masks a quiet high one far more effectively than the reverse (Chapter 7), because the low tone’s traveling wave passes over, and excites, the region belonging to the high tone on its way to its own place. The high tone’s wave never gets near the low tone’s region at all. This is called upward spread of masking, and it is why a bass guitar buries a triangle and a triangle does not bury a bass guitar.
The Tonotopic Map
The place-to-frequency correspondence is called tonotopic organization, and it is preserved all the way up: the auditory nerve, the brainstem nuclei, and the auditory cortex are all laid out as maps of frequency. The brain receives something that is already sorted by frequency before any neural processing has happened.
This is the physiological basis of Ohm’s acoustic law from Chapter 5. The ear is, mechanically, something very like a Fourier analyzer. And because it encodes place, while the relative timing between distant places is not preserved, the phase relationships among widely separated harmonics are discarded, exactly as the listening experiment showed.
Figure 6.7:The National Institutes of Health follows vibration through the eardrum and ossicles, into the cochlea and hair cells, and finally along the auditory nerve. The animation connects the traveling wave on the basilar membrane to the neural signal it produces.
Watch on YouTube: Journey of Sound to the Brain
6.4From Motion to Nerve Impulse
Hair Cells and the Organ of Corti
Sitting on the basilar membrane is the organ of Corti, containing about hair cells, each carrying a bundle of fine projections called stereocilia.
When the membrane moves, the stereocilia are bent sideways. Bending them one way pulls open molecular gates and lets ions flood into the cell; bending them the other way closes them. The cell’s voltage therefore follows the motion of the membrane, and that voltage change triggers the release of neurotransmitter onto the auditory nerve fibers beneath.
The mechanism is direct, a mechanical gate, opened by a physical tug, so hearing is fast. There is no chemical cascade of the kind vision uses, and the latency is a matter of microseconds.
Inner and Outer Hair Cells
There are two kinds, in very different numbers, and their roles were a genuine surprise.
Inner hair cells, about of them in a single row, are the sensors. They carry roughly of the fibers going to the brain. These are what hearing is made of.
Outer hair cells, about in three rows, are mostly not sensors at all. Most of their connections run from the brain, and their job is to change length in response to the voltage across them, fast enough to follow an audio-frequency signal.
That makes them an active amplifier. An outer hair cell detects the local motion and pushes in phase with it, feeding energy back into the membrane. The consequence is a sharpening of the traveling wave’s peak, a rise in the effective of Chapter 4, by a factor of 100 to 1000 at low levels, and a corresponding improvement in both sensitivity and frequency selectivity.
Outer hair cells are also the first casualties of noise exposure, so noise-induced hearing loss shows up first as a loss of clarity in noisy places rather than as a loss of volume: the amplifier has gone, taking the sharpening with it, and sounds that used to be separable now blur together.
Place, Timing, and the Volley Principle
There is a second stream of information alongside place.
Auditory nerve fibers tend to fire at a particular phase of the basilar membrane’s motion, phase locking. A fiber does not fire on every cycle, but when it fires, it fires at the same point in the cycle. Pool many fibers and the aggregate firing pattern carries the waveform’s period directly, a mechanism known as the volley principle.
Phase locking works up to about 4–5 kHz and degrades above that, because the nerve cannot maintain timing precision at those rates.
That number is suspicious. The top note of a piano is 4186 Hz. Almost all melodic instruments have their fundamentals below about 4 kHz: that is, within the range where timing information is available. Above it, pitch perception becomes markedly worse: listeners are poor at recognizing melodies made of pure tones above 5 kHz, and poor at tuning them. The musical range appears to stop about where the temporal mechanism does, and Chapter 8 takes up what that implies about how pitch is computed.

Figure 6.8:Veritasium demonstrates illusions that depend on how the ear and brain localize and interpret sound. They are reminders that hearing is an inference made from neural evidence, not a literal copy of the pressure waveform.
Watch on YouTube: These Illusions Fool Almost Everyone
6.5Limits and Damage
The Audible Range and How It Narrows
The nominal range of human hearing is 20 Hz to 20 kHz, and the upper figure applies to a young person with undamaged ears. It falls steadily with age, a process called presbycusis, at roughly a kilohertz per decade after the twenties, and it falls from the top down, because the base of the cochlea, which handles high frequencies, bears the brunt of a lifetime’s exposure.
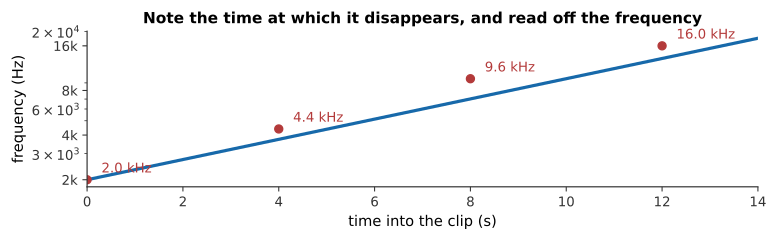
Figure 6.9:A sweep from 2 kHz to 18 kHz. Note the moment it disappears and read the frequency off the figure. Two warnings before drawing conclusions: many playback systems roll off above 15 kHz on their own, and the clip is not corrected for the ear’s frequency response, so the apparent loudness changes as it climbs. This is an indication, not an audiogram.
What you hear: A rising tone that climbs steadily for about fourteen seconds. At some point it becomes inaudible; when depends on the listener, on the playback system, and on the volume.
Listen: Upper Limit Sweep
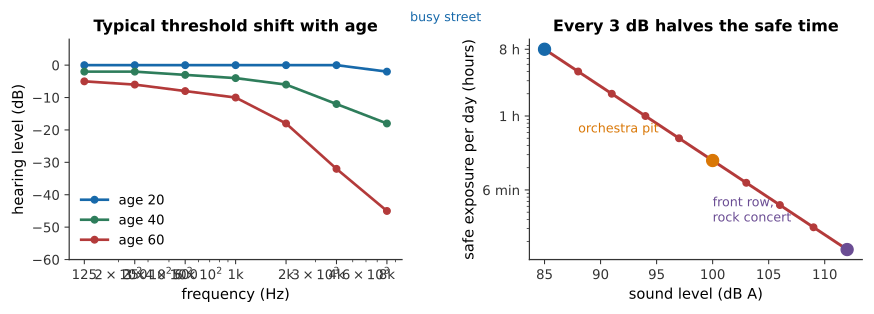
Figure 6.10:Left: typical threshold shift with age, which is concentrated at the high-frequency end. Right: safe exposure limits. Every 3 dB doubles the sound energy and therefore halves the time you can safely be exposed: the difference between 100 dB and 112 dB is the difference between fifteen minutes and under a minute.
Noise-Induced Hearing Loss
The damage is mechanical, and it is permanent.
Excessive sound overdrives the hair cells, and the stereocilia break or fuse. Hair cells in mammals do not regenerate. There is no recovery, no treatment, and no replacement, only prevention.
Three things make this more dangerous for musicians than for most people.
Temporary threshold shift is misleading. After a loud rehearsal, hearing is dulled and returns to normal within a day, which feels like the ear repairing itself. It is not. Each episode leaves a small permanent component, and the permanent components accumulate over years.
It is painless and gradual. Nothing hurts, and the loss appears first at frequencies above the range that carries most musical fundamentals. By the time a player notices, a great deal has usually been lost.
Damage can announce itself as a sound rather than a silence. Many musicians who lose hair cells at some frequency band do not experience that band as simply quieter; they experience tinnitus, a persistent ringing, hissing, or whining heard in the absence of any external sound. The leading explanation follows directly from the mechanism above: the brain’s auditory pathway, deprived of its normal input at the damaged frequencies, turns up its own gain there, and the resulting spontaneous neural activity is heard as a tone. Tinnitus is common, often permanent once established, and, like the hearing loss that usually causes it, is easier to prevent than to treat.
The exposure limits are stricter than they look. The right-hand panel above is a 3 dB exchange rate: 85 dB for eight hours, 88 dB for four, 91 dB for two. An orchestra pit routinely reaches 95 dB, and a brass section measures over 110 dB at the player’s own ear.
Exposure Limits for Musicians
The practical measures are unglamorous and they work.
Wear musician’s earplugs. These are not foam plugs. Foam attenuates the high frequencies much more than the low ones, which makes music sound muffled and wrong, and players take them out. Musician’s plugs use an acoustic filter to attenuate roughly evenly across the spectrum, typically 9, 15, or 25 dB, so the sound is quieter but not distorted. Nine decibels is a factor of eight in energy, and it multiplies safe exposure time by eight.
Use distance. The inverse-square law of Chapter 2 is free protection: doubling your distance from a loud source buys 6 dB, which quadruples the safe time.
Use time. Damage depends on total energy, so breaks are not merely a rest, they are a direct reduction in the dose.
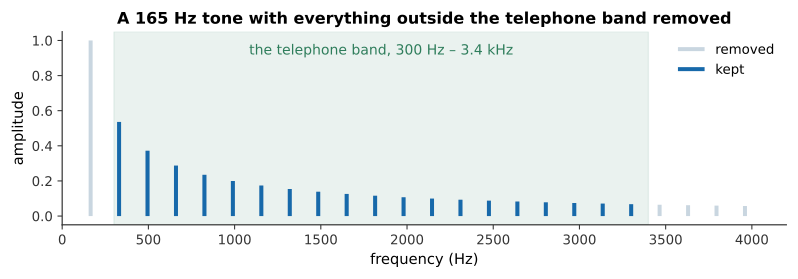
Figure 6.11:Everything outside 300 Hz to 3.4 kHz removed. Speech through this band stays perfectly intelligible, which is what the telephone was designed around, and it is roughly the band the outer and middle ear favor. Music through it does not survive nearly as well, which is a useful reminder that intelligibility and fidelity are different requirements.
What you hear: The same note twice. The first is full and warm; the second is thin and boxy, like a voice on an old telephone, though the pitch is identical.
Listen: Full spectrum, Telephone band only
6.6Summary
The ear solves an impedance-matching problem. An air–fluid boundary reflects about of incident sound, a loss of 30 dB; the middle ear recovers about 27 dB of it.
The pinna imposes a direction-dependent filter on the spectrum, which is the only cue distinguishing front from back and up from down.
The ear canal is a stopped pipe about 25 mm long, resonating near 3.4 kHz, which is a large part of why hearing is most sensitive there.
The middle ear’s gain is mostly area ratio ( to , a factor of 17) with a smaller contribution from the ossicular lever (1.3), giving about 22 times the pressure, or 27 dB.
The basilar membrane is stiff and narrow at the base, floppy and wide at the apex, so each place responds best to one frequency. The map is logarithmic: equal musical intervals occupy equal distances, an octave being about 3.5 mm.
A traveling wave builds gradually and cuts off sharply past its peak. The asymmetry produces the upward spread of masking: low tones mask high ones far more than the reverse.
Inner hair cells sense; outer hair cells amplify. The outer cells change length in phase with the motion, sharpening the response by a factor of 100–1000 and producing measurable otoacoustic emissions. They are also the first thing noise destroys.
Phase locking carries timing information up to about 4–5 kHz, very nearly the top note of a piano, and roughly where reliable pitch perception stops.
Noise-induced hearing loss is mechanical, cumulative, painless, and permanent, since mammalian hair cells do not regenerate. Every 3 dB halves the safe exposure time. Musician’s earplugs, distance, and breaks all work.
Tinnitus, a phantom ringing or hissing, often accompanies hair-cell damage: the brain raises its gain at frequencies it no longer receives input from, and the spontaneous activity is heard as sound.
6.7Check Your Understanding
Five short, auto-graded questions cycle within one compact activity, using five different response styles.
Multiple response. Which choices reduce risk during a loud rehearsal: flat-response musician’s earplugs, quiet breaks, greater distance from loud sources, or relying on pain as an early warning?
True or false. Inner hair cells provide most cochlear amplification, while outer hair cells send most auditory information to the brain.
Drag the words. Complete the roles of the cochlear base and apex and of inner and outer hair cells.
Fill in the blanks. For the same risk, every increase of ___ dB cuts safe exposure time in ___.
Mark the words. Identify the structures responsible for directional filtering, impedance matching, and frequency separation: “The pinna supplies direction-dependent filtering, the middle ear matches air to cochlear fluid, and the basilar membrane separates frequencies by place.”
6.8Conceptual Questions
Explain why an ear consisting only of a membrane over a fluid-filled cavity would be about 30 dB less sensitive than a human ear, and what the middle ear does about it.
The ear canal is about 2.5 cm long. Explain why this produces a sensitivity peak near 3–4 kHz, and identify which boundary condition applies at each end.
Explain why the pinna is necessary for telling a sound in front from the same sound behind, given that the two ears alone locate sounds left and right perfectly well.
The basilar membrane’s frequency map is logarithmic in frequency and linear in distance. State what this implies about the physical distance occupied by an octave, and connect it to why the octave is musically special.
A loud bass note masks a quiet high note much more than a quiet high note masks a loud bass note. Explain this using the shape of the traveling wave.
Distinguish the roles of inner and outer hair cells, and explain why damage to the outer cells shows up first as difficulty understanding speech in a noisy room rather than as a loss of loudness.
The acoustic reflex takes about 50 ms to engage and fatigues over time. Explain why this makes it useless against the two kinds of exposure that actually damage hearing.
Phase locking fails above about 4–5 kHz, and the highest note on a piano is 4186 Hz. Discuss whether this is likely to be a coincidence.
Tinnitus is usually described as a sound heard in the absence of any external stimulus, yet it typically follows damage at a specific frequency band. Explain why the pitch of the phantom sound and the location of the damage are connected, using the tonotopic map.
6.9Problems
Solution to Exercise 6.1 #
(a) A stopped pipe has for odd :
(b) The next mode is the third harmonic:
(c) Yes, comfortably, 10.3 kHz is well within the 20 Hz to 20 kHz range, though the ear is considerably less sensitive there than at 3.4 kHz.
Therefore, the canal contributes resonances at about 3.4 kHz and 10 kHz, and the first of these coincides with the region of greatest sensitivity.
Solution to Exercise 6.2 #
Solution to Exercise 6.3 #
(a) The ratio is
so the threshold displacement is about a tenth of an atomic diameter.
(b) A level difference of 120 dB in pressure corresponds to an amplitude ratio of
So the displacement at the threshold of pain is
Therefore, the eardrum’s working range runs from a tenth of an atomic diameter to about a hundredth of a millimeter: a millionfold span, handled by one membrane.
Solution to Exercise 6.4 #
(a) The range is a factor of 1000, so
(b) Dividing the length by the octaves:
(c) One semitone is a twelfth of an octave:
Therefore, a semitone occupies about three tenths of a millimeter of membrane. Given that the just-noticeable frequency difference is far smaller than a semitone (Chapter 8), the ear plainly resolves pitch far more finely than this spacing alone would allow, which is one of several reasons place cannot be the whole story.
Solution to Exercise 6.5 #
(a) Each 3 dB halves the allowed time. From 85 to 94 dB is 9 dB, or three halvings:
(b) Eight hours against one hour permitted: a factor of 8.
(c) To come back inside the limit the level must drop by 9 dB, so a plug of 9 dB attenuation or more: the lowest rating musician’s plugs are commonly made in.
Therefore, a 94 dB rehearsal day is eight times the safe dose, and the standard 9 dB musician’s plug is exactly enough to fix it.
Solution to Exercise 6.6 #
(a) Using the 3 dB rule from 85 dB for 8 h:
Left ear, dB, six halvings:
Right ear, dB, two halvings:
(b) The left ear is very close to the instrument, perhaps 15 cm from the f-holes, while the right is nearly an arm’s length away and shadowed by the head. The inverse-square law of Chapter 2 accounts for most of the 12 dB.
The practical step is an earplug in the left ear at minimum. Left-ear hearing loss is a well-documented occupational pattern among violinists and violists, and it follows directly from this geometry.
Solution to Exercise 6.7 #
Solution to Exercise 6.8 #
(a) Bandwidth is , so raising from 1 to 10 narrows the bandwidth by a factor of 10.
At 1 kHz: from Hz to Hz.
(b) A bandwidth of 1000 Hz centered on 1000 Hz runs roughly 500 to 1500 Hz:
A bandwidth of 100 Hz runs roughly 950 to 1050 Hz:
Therefore, the active amplifier takes the ear’s frequency resolution from about an octave and a half down to under two semitones. Losing the outer hair cells does not merely make sounds quieter; it makes them run together, which is exactly what people with noise damage report.
Solution to Exercise 6.9 #
(a) A 35 dB shift in intensity terms is
so the sound must be about 3200 times more intense to be detected.
(b) Their threshold at 4 kHz is now 35 dB SPL rather than roughly 0. A 70 dB SPL cymbal is 35 dB above their threshold, so yes, they hear it, but at what a normal listener would experience as a much quieter sound.
Therefore, moderate high-frequency loss does not silence the cymbal; it dulls it. Such loss often goes unnoticed for a long time, and is usually detected first by an audiogram rather than by the person.
Solution to Exercise 6.10 #
(a) At three filters per octave over ten octaves:
(b) There are about 3500 inner hair cells, so roughly
inner hair cells per critical band.
Therefore, the cochlea has of order thirty independent frequency channels but more than a hundred sensors in each. The redundancy is what allows the system to average away noise, which is how a detector working below the thermal-motion limit can function at all, and it also explains why substantial hair-cell loss can occur before any change is noticed.
Solution to Exercise 6.11 #
(a) s, or 0.22 ms.
(b) cycles.
(c) No single fiber can fire on every cycle: it must sit out at least four of every five. But each fiber, when it does fire, fires at the same phase. Different fibers sit out different cycles, so pooling across many fibers reconstructs a firing pattern with a peak on every cycle, even though no individual contributor managed one.
Therefore, the population encodes a periodicity far faster than any of its members. This is the volley principle, and it is the mechanism that gives the auditory system timing information across the whole musically useful range.
Solution to Exercise 6.12 #
(a) Doubling the distance in a free field reduces the level by
(b) The earplug gives 9 dB.
The earplug wins by 3 dB, which, on the 3 dB exchange rate, is a further factor of two in safe exposure time.
Therefore, the plug is better, and the two combine: moving and plugging gives 15 dB, which is a factor of 32 in permitted time. It is also worth noting that in a real hall the distance benefit would be less than 6 dB, because beyond the critical distance of Chapter 2 the reverberant field stops falling off with distance at all.
Solution to Exercise 6.13 #
The foam plug’s attenuation differs by
between 250 Hz and 4 kHz. In amplitude terms the high frequencies are attenuated
times more than the low ones.
The effect is a drastic tilt of the spectrum: an instrument’s fundamental passes nearly unaffected while its upper harmonics are cut to a twentieth. Since Chapter 5 showed that the upper harmonics are what timbre is made of, the result is a muffled, boxy sound in which a player can neither judge their own tone nor hear the rest of the ensemble properly.
The musician’s plug attenuates by the same 15 dB at both ends, so the spectrum is preserved and only the level changes.
Therefore, the foam plug offers more attenuation but destroys the information the musician needs, so it gets taken out, and a plug that is not worn attenuates nothing at all.
Solution to Exercise 6.14 #
(a) The 200 Hz tone. Its traveling wave must run almost the full length of the basilar membrane to reach its own place near the apex, and it excites the 3000 Hz region on the way past. The 3000 Hz wave peaks near the base and dies before reaching the apex, so it never disturbs the low-frequency region at all.
(b) Raising the hi-hat increases the total level without changing the fact that the bass is still spreading excitation across the hi-hat’s region, and a louder mix simply moves both closer to the point where masking is strongest. Reducing the bass removes the masker itself, which lets the hi-hat through at a level it was already loud enough to reach.
Therefore, masking is asymmetric, and the remedy is to attend to the masker rather than the masked. Mixing engineers talk about “making space” by cutting rather than boosting for exactly this reason: it is the asymmetry the traveling wave predicts.