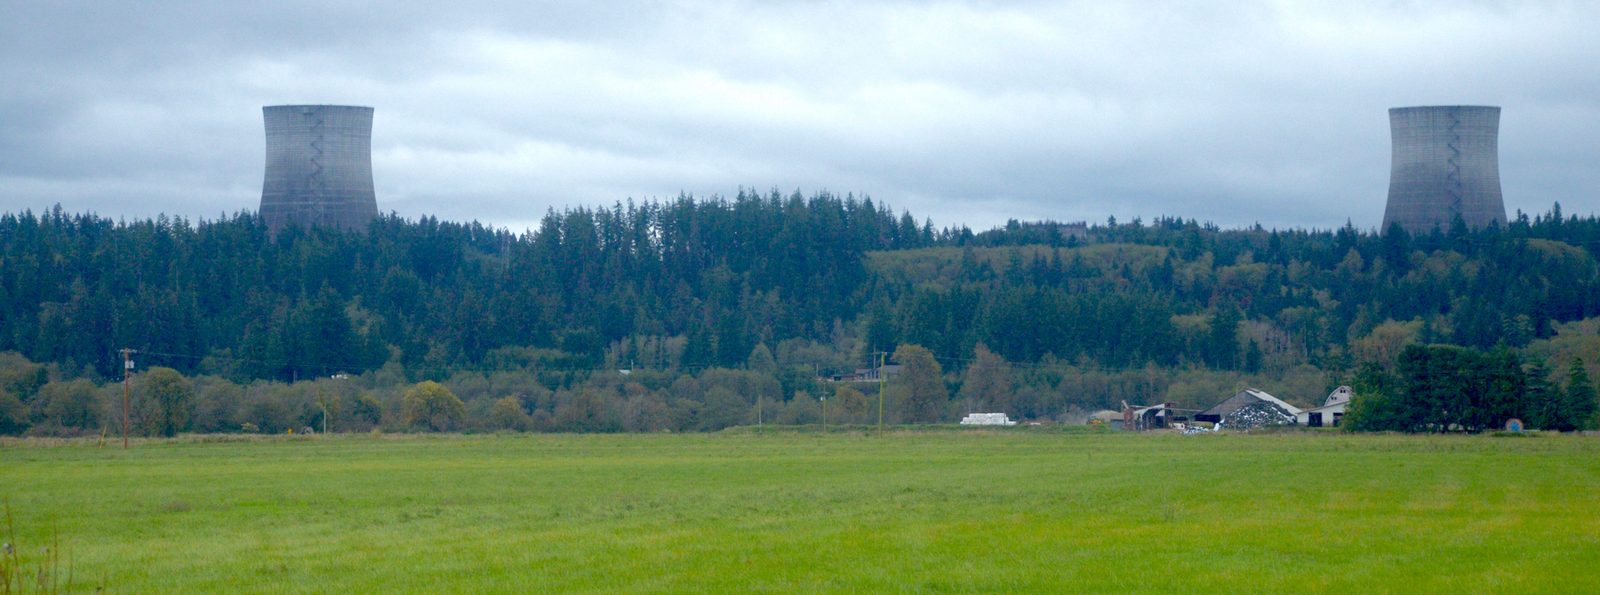
Cooling towers of the decommissioned Satsop nuclear power plant in Washington. Photo credit: Tom Murphy
15. Nuclear Energy
Most of the energy forms discussed thus far derive from sunlight— either contemporary input or fossilized storage. The fuel for nuclear energy is truly ancient, predating the solar system. The heavy elements participating in fission were produced by astrophysical cataclysms (most likely merging neutron stars), while the hydrogen building blocks for fusion originated in the Big Bang itself. In brief, fission involves the splitting of heavy nuclei into smaller pieces, while fusion builds larger nuclei from smaller ones.
While only fission has been successfully implemented as a source of societal energy, both types essentially boil down to the same thing: a source of heat to make steam and drive a heat engine. How and why nuclear material generates heat will be a primary focus of this chapter. Many practical concerns surround nuclear power, such as safety, weapons, waste, and proliferation of dangerous material. Self-pride for the impressive accomplishment of mastering nature well enough to implement nuclear power may not adequately justify continued reliance upon it—even if it is not a direct emitter of CO.
Understanding nuclear energy requires a longer journey than was needed for hydroelectricity, wind, and solar photovoltaics. We first learn about the nucleus and its many configurations, how nuclei transform from one to another through radioactive decay, the role plays, and finally dig into the workings of fission and fusion.
15.1 The Nucleus
First, what is a nucleus? Every (neutral) atom consists of a positively-charged nucleus surrounded by a cloud of negative electrons (Figure 15.1).
The nucleus is about 100,000 times smaller than the electron cloud,[1] but contains 99.97% of the atom’s mass in a super-dense nugget composed of protons (positive charge) and neutrons (no charge). While electromagnetic forces vehemently resist the close congregation of positively-charged protons, the strong nuclear force overpowers this objection and sticks the protons and neutrons together in a stable existence.

Figure 15.1:Zooming in on an atom in steps of . At left, we see the entire extent of the atom’s electron cloud. For a while, no nucleus is visible, being 100,000 times smaller than the atom itself. The nucleus within an atom is like a small dust grain in a bedroom.
By convention, the number of protons is labeled as and the number of neutrons as . The total number of nucleons[2] is called the mass number: . It’s just counting.
Picking carbon as an example, all carbon atoms have : six protons.[3] Most carbon atoms (98.93%) have , making . But some isotopes carry a different number of neutrons. In natural carbon samples, 1.07% have , making . We label such an isotope as , or sometimes ; , or even in some cases the fully-described ; ; . The latter two forms are somewhat redundant—though sometimes appreciated/helpful— because all carbon atoms have , and always. Therefore, says it all, provided you can easily find or remember the number for carbon.[4] The general pattern for an isotope of element X is X. Other common designations are, for example, C12, C13, U238, or C-12, C-13, U-238 as alternatives to , and U, respectively.
The physicist’s version of the periodic table is called the Chart of the Nuclides, and contains a wealth of information. The basic layout idea is introduced in Figure 15.2, for the extreme low-mass end of nuclides.
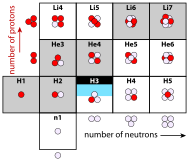
Figure 15.2:Lower left start of the Chart of the Nuclides, shown pictorially in terms of the number of protons (red) and number of neutrons (lavender) in each nuclide. Gray boxes are stable nuclides, and H3 (tritium) is semi-stable for a decade or so.
Figure 15.3 provides a full view of the chart layout: neutron number, , runs horizontally and proton number, , runs vertically. Stable nuclei are indicated by black boxes at some particular integer value of and . Notice how they bend away from the line, preferring to be neutron-rich. This can be traced to the fact that protons repel each other due to their electric charge, so the nucleus can be more tightly bound if fewer protons than neutrons are present—balanced against another penalty for being too far away from .
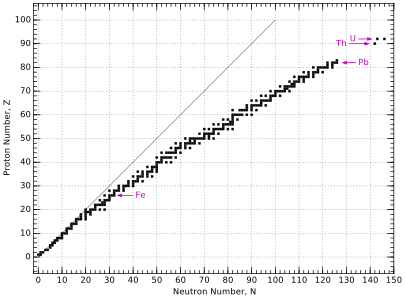
Figure 15.3:Layout of the Chart of the Nuclides, showing positions of naturallyoccurring nuclei (stable or long-lived enough to be present on Earth). Stable nuclei tend to have more neutrons than protons—especially for heavier nuclei. This is why the track of stable nuclei bends away from the diagonal line. Arrows point to important elements of iron, lead, thorium, and uranium at values of 26, 82, 90, and 92, respectively.
Figure 15.4 shows the lower-left corner of the chart in much greater detail.[5] For each element (horizontal row), properties of all known isotopes are listed—even those that are radioactive and do not persist for even a small fraction of a second before decaying. Stable isotopes are denoted by gray boxes. The mass of each, in atomic mass units (a.m.u.)— defined so that the neutral atom is exactly 12.0000 a.m.u.—is given, and the natural abundance as found on Earth, in percent. The Chart of the Nuclides lets us peak inside the periodic table in great detail, as Example 15.1.2 suggests.
Because the Chart of the Nuclides has neutron number, , increasing from left to right, and proton number, , increasing vertically, nuclei having the same mass number, , are arranged on diagonals. Notice that in the region shown in Figure 15.4, we never find more than one stable element at each mass number (constant .
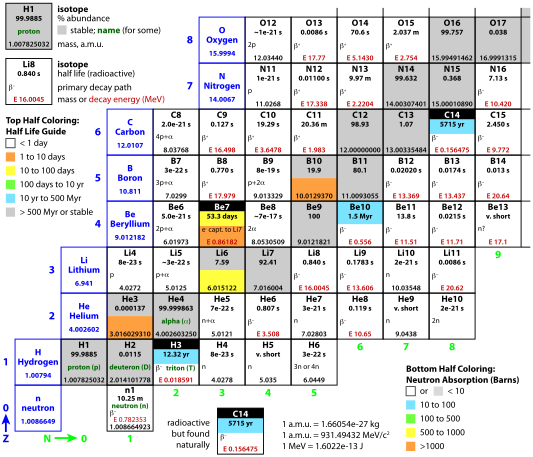
Figure 15.4:Chart of the Nuclides for the low-mass end. Neutron number, , increases toward the right (green numbering at bottom) and proton number, , increases vertically (blue numbering at left). Scientific notation is expressed as, e.g., 8e–23, meaning 8 . A wealth of information is included: spend some time studying the surrounding guides to learn what data each box contains.
15.2 Radioactive Decay
When one nuclide, or isotope changes into another, it does so by the process of radioactive decay. Stable nuclides have no incentive to undergo such decays, but unstable nuclides will seek a more stable configuration through the decay process.
The black squares in Figure 15.3, or gray squares in Figure 15.4 are stable,[7] leaving all others as unstable,[8] meaning that they will undergo radioactive decay to a different nucleus after some time interval that is characterized by the nuclide’s half life.
Figure 15.4 lists a half-life[9] for each unstable nuclide. For example, the half-life for a neutron (n1 in Figure 15.4) is 10.25 minutes, meaning that a lone neutron has a 50% chance of surviving this long. The process is statistical, so an individual neutron might only last 3 seconds, or might still be around in 15 or even 60 minutes. The predictive power is sharpened the larger the sample is: half will remain after 10.25 minutes.
Table 15.1:Decay of 16 million (M) neutrons, having a half life of 10.25 minutes, mirroring Example 15.2.1. Time is in minutes. The number remaining at each step is given, as well as the probability of any particular neutron surviving this long. After about four hours, only one would be expected to remain (and not for much longer).
| Time (min) | Half Lives | Remain | Prob. |
|---|---|---|---|
| 0 | 0 | 16 M | 100% |
| 10.25 | 1 | 8 M | 50% |
| 20.5 | 2 | 4 M | 25% |
| 30.75 | 3 | 2 M | 12.5% |
| 41.0 | 4 | 1 M | 6.25% |
| ⋮ | ⋮ | ⋮ | ⋮ |
| 102.5 | 10 | 15,625 | 0.1% |
| ⋮ | ⋮ | ⋮ | ⋮ |
| 246 | 24 | 1/16M |
Luckily, radioactive decays don’t go just any which way, but stick to a very small menu of possible routes. When a decay happens, the nucleus always spits something out, which could be an electron, a positron, a helium nucleus (called an alpha particle), a photon, or more rarely might spit out one or more individual protons or neutrons. Because these particles can emerge at high speed (high energy), they are like little bullets firing at random times and directions into their surroundings. These bullets are potentially damaging to materials and biological tissues—especially DNA, able to cause mutations and/or initiate cancerous growth. The primary decay mechanisms pertaining to the vast majority of decays are listed below and accompanied by Figure 15.5.
⚠⚠⚠ ⚠⚠

Figure 15.5:Radioactive decay mechanisms for , and . Protons are colored red, and neutrons light purple. The total nucleon counts
are correct for the two beta decays, but only schematic for the larger Nd nucleus used to illustrate alpha decay, which is predominantly
5 8
seen only in heavier nuclei (aside from Li and Be ). The positron is an anti-electron: a positively-charged antimatter counterpart to the
electron. Neutrinos are sometimes called “ghost” particles for their near-complete non-interactivity with ordinary matter.
Alpha decay , in which a foursome of two protons and two 4
neutrons—essentially a He nucleus—leaps out.[10] When this happens, the nucleus reduces its by two, reduces its by two, and therefore by 4. On the chart of the nuclides, it moves two squares left and two squares down (see Figure 15.7). For example, Be 4
decays this way, essentially splitting into two He nuclei;
Beta-minus decay is a manifestation of the weak nuclear force, in which a neutron within the nucleus converts to a proton, and in the process spits out an electron particle, really just to conserve total electric charge, and a neutrino—which we will ignore.[11] The mass number, is unchanged, but goes down one and goes up one (gaining a proton and losing a neutron). Thus on the chart of nuclides the motion is one left, one up. It’s like a chess move (Figure 15.7);
Beta-plus decay, like , is a manifestation of the weak nuclear force, in which a proton within the nucleus converts to a neutron, emitting a positron , or , or anti-electron; a form of antimatter) again maintaining charge conservation, and an ignored neutrino. Similar to decay, is unchanged, but is reduced by one and gains one. On the chart, the move is diagonal: down one and right one (Figure 15.7).
Gamma decay happens when a nucleus is in an excited energy state, having been rattled by some other decay or bombardment, and it emits a high-energy photon, called a gamma ray, as it settles into a lower energy state (Figure 15.6). For decays, , and do not change, so the nucleus does not morph into another flavor, and thus does not move on the Chart of the Nuclides.
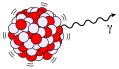
Figure 15.6:Gamma decay of an excited nucleus.
Figure 15.7 demonstrates the motion of each of these decays on the Chart of the Nuclides, and Table 15.2 summarizes the nucleon arithmetic.
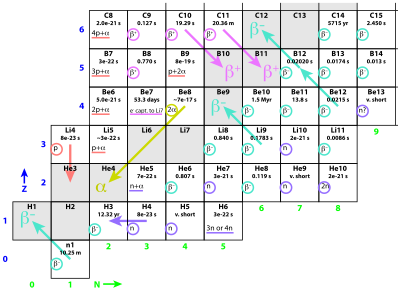
Figure 15.7:Radioactive decays shown as moves on the “chess board” of the Chart of the Nuclides. The different decay types are color-coded to match Figure 15.8, and are only shown in a few representative squares. Decays frequently occur in a series, one after the other (a decay chain), as hinted
Table 15.2:Summary of decay math on nucleon counts.
| Decay | |||
|---|---|---|---|
| unchanged | |||
| unchanged | |||
| unchanged | unchanged | unchanged |
As is evident in Figure 15.8, unstable isotopes above the stable track in Figure 15.3 tend to undergo decays to drive toward stable nuclei, while those below the track tend to experience decays to drive up toward the stable track. The decays are more common for heavy nuclei (around uranium), which drive toward the end of the train of stable elements in Figure 15.3, ending up around lead (Pb). We can understand the abundance of lead as a byproduct of heavy-element decay chains.
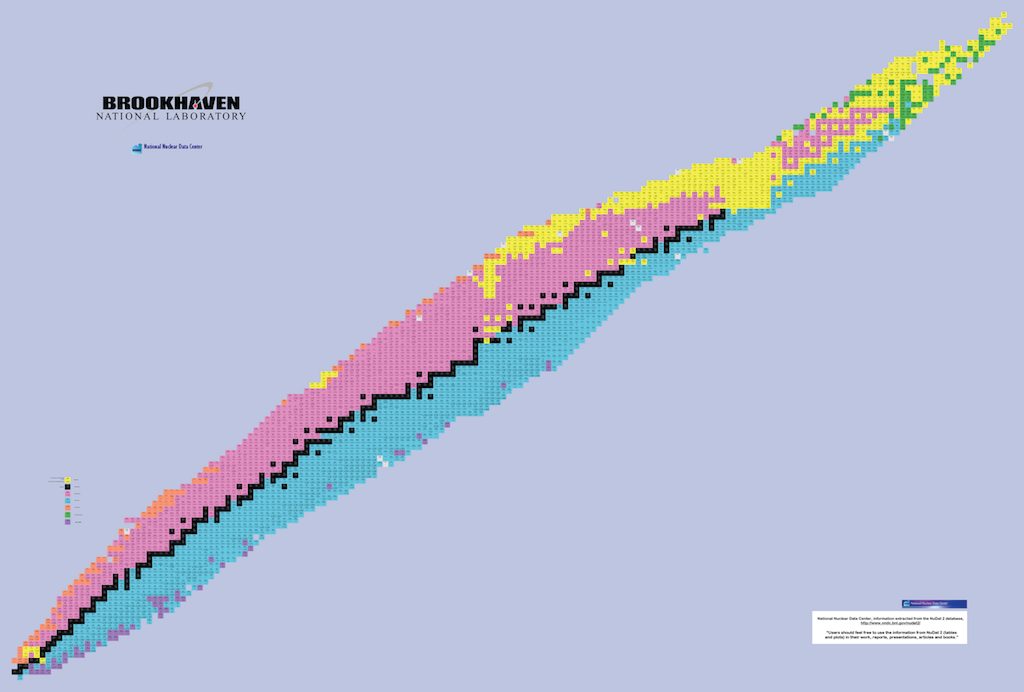
Figure 15.8:Another view of the Chart of the Nuclides, color coded to indicate prevailing decay modes as a function of position on the chart. Note that sometimes captures an electron rather than emitting a positron, but amounting to the same thing, essentially. From U.S. DoE.
15.3 Mass Energy
Energy—whatever the form—has mass and actually changes the weight of something, although almost imperceptibly. A hot burrito has more mass than the exact same burrito—atom for atom—when it’s cold.[12] Most of us are familiar, at least casually, with the famous relation . More helpfully, we might express it as
where the symbols indicate a change in energy or mass, and 3 m/s is the speed of light. Using kilograms for mass results in Joules for energy. Because is such a large number (nearly , the mass change associated with daily/familiar energy quantities is negligibly small. Box 15.2 explains why is valid for all energy exchanges—not just nuclear ones—but generally results in mass changes too small to measure in non-nuclear contexts. Earlier, we discussed conservation of energy. More correctly, we observe conservation of mass-energy. That is to say, a system can actually gain or lose net energy if the mass changes correspondingly. In the case of nuclear energy release, the “new” energy comes at the expense of reduced mass.
In practice, and perhaps surprisingly, atoms (nuclei) weigh less than the sum of their parts due to binding energy. In order to rip a nucleus completely apart and move all the nucleons far from each other, energy must be put in (left part of Figure 15.9). And any change in energy is accompanied by a change in mass, via . All the energy that must be injected to completely dismantle the nucleus weighs something! So the mass of the individual pieces after dismantling the nucleus is effectively the mass of the original nucleus plus the mass-equivalent of all the energy that was put in to tear it apart (middle panel of Figure 15.9). Therefore, binding energy effectively reduces the mass of a nucleus, which we will now explore quantitatively.
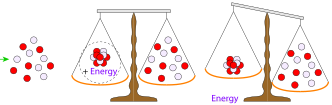
Figure 15.9:One must add energy to overcome nuclear binding energy in order to bust up a nucleus into its constituent nucleons (left). Thus, the collective mass of a nucleus plus the mass associated with the energy it takes to break it apart (via must be equal to the sum of the masses of the constituent parts (middle). Therefore, if we compare the mass of the nucleus alone (removing the energy’s mass from the scale) it must be less than the mass of the loose collection of nucleons (right).
⚠⚠⚠⚠⚠⚠+ Energy ⚠ ⚠
A careful look at Figure 15.4 reveals that lighter stable nuclei (gray-squares) at the lower left of the chart have a mass a little larger than the corresponding mass number, but by the upper right—around oxygen— the mass has edged just lower than . Table 15.3 shows this trend, confirmable in Figure 15.4 for the first four nuclides in the table. The difference between mass and is most negative around iron, then turns around and becomes positive again for heavy elements like uranium.
Table 15.3:Example mass progression.
| Nuclide | mass (a.m.u.) | |
|---|---|---|
| 2 | ||
| H | 2 | 2.014 |
| 4 | ||
| He | 4 | 4.003 |
| 12 | ||
| C | 12 | 12.000 |
| 16 | ||
| O | 16 | 15.995 |
| 56 | ||
| Fe | 56 | 55.935 |
| 235 | ||
| U | 235 | 235.044 |
What is going on here? If the mass of a nucleus were just the sum of its parts, we would expect the total mass to just track linearly as we add more pieces. In fact, if we try to build a neutral carbon atom out of 6 protons, 6 neutrons, and 6 electrons, the sum, according to Table 15.4, should be 12.099 a.m.u., not 12.000. The discrepancy is due to nuclear binding energy, as was introduced in Figure 15.9.
Table 15.4:Constituent masses of atomic building blocks, expressing the same basic thing in three common units systems.
| Particle | a.m.u. | 10-27 kg | MeV |
|---|---|---|---|
| proton | 1.0072765 | 1.6726219 | 938.2720882 |
| neutron | 1.0086649 | 1.6749275 | 939.5654205 |
| electron | 0.00054858 | 0.000911 | 0.510999 |
| (a.m.u.) | 1.0000000 | 1.660539 | 931.494102 |
Nuclear binding energy is incredibly strong[15] and is able to overpower the natural electric repulsion between positively charged protons and stick them together in an unwilling bunch. The strong nuclear force only acts over a tiny range within about 10-15 m:[16] it is very powerful
on short length scales, but ceases to operate much beyond the confines of the nucleus. Think about binding energy this way: if we tried to pry a proton or a neutron (nucleon, generically) away from a nucleus, we would encounter a very powerful force opposing the action. But let’s say we persist, and do work in extracting the nucleon by the usual recipe of force times distance. It is so much work, in fact, that becomes relevant, measurably altering the mass.
Table 15.5 walks through some example calculations, one of which is 1
traced in Example 15.3.2. Because the H nuclide is just a lone proton, it has no binding energy.
Table 15.5:Example nuclear binding energy calculations. The second column is the simple sum of masses of protons, neutrons, and electrons, per Table 15.4. Next is measured mass, then the difference. The difference is re-cast in MeV, representing the total binding energy of the nucleus, inexorably rising with the size of the nucleus. The final column divides by the mass number to get binding energy per nucleon, which peaks around iron. See Example 15.3.2 to understand how these numbers are computed.
| Nucleus | actual | (MeV) | MeV per nucleon | ||
|---|---|---|---|---|---|
| 1 | |||||
| H | 1.007825 | 1.007825 | 0 | 0 | 0 |
| 2 | |||||
| H | 2.016490 | 2.014102 | 0.002388 | 2.22 | 1.11 |
| 4 | |||||
| He | 4.032980 | 4.002603 | 0.030377 | 28.29 | 7.07 |
| 12 | |||||
| C | 12.09894 | 12.000000 | 0.098940 | 92.16 | 7.68 |
| 56 | |||||
| Fe | 56.46340 | 55.934942 | 0.528447 | 492.25 | 8.79 |
| 235 | |||||
| U | 236.9590 | 235.043920 | 1.915065 | 1783.85 | 7.59 |
Therefore, the difference between the sum-of-parts mass and actual nucleus mass in Table 15.5 provides a measure of how much binding energy holds the nucleus together.[20]
Notice that the first entry in Table 15.5 for the single-proton hydrogen atom has no binding energy in the nucleus: the lonely proton has no 2
other nucleon to which it might bind. But deuterium ( H) has a proton and a neutron, held together by 2.2 MeV of binding energy. The binding energy per nucleon in the last column of Table 15.5 starts out small, but soon settles to the 7–9 range for most of the entries. It is extremely insightful to plot the binding energy per nucleon as a function of the nucleon mass number, , which we do in Figure 15.10.
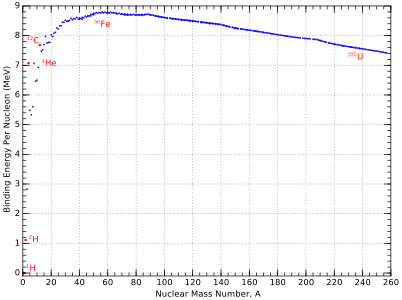
Figure 15.10:Binding energy per nucleon as a function of total mass number, . The nuclei featured in Table 15.5 are indicated
The value of Figure 15.10 is hard to over-emphasize. Key take-aways are:
Most nuclei are at around 8 MeV per nucleon, meaning that it would take an average of about 8 MeV of energy to rip out each member (proton or neutron) from a nucleus;
The peak is at Fe,[21] meaning that this is the most tightly bound nucleus;[22]
The slope on the left side is much steeper than the slope on the right side, after the peak, which speaks to why fusion (building from small to big) is more potent than fission (tearing apart very massive nuclei);
Fusion in stars does not build elements beyond the peak around iron, since to go beyond the peak is not energetically favorable.
It can be helpful to think of Figure 15.10 upside-down, as in Figure 15.11, turning the iron “peak” into a trough. A ball will roll toward and settle near the bottom of the trough, which is what both fusion and fission do, but from opposite directions.
15.4 Fission
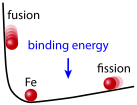
Figure 15.11:Turning the binding energy curve upside-down makes it easier to conceptualize fusion and fission driving toward the most tightly bound point (iron), like a ball might roll.
Having covered some fundamentals, we are ready to tackle aspects of nuclear energy. Really it is very simple. Enough nuclear material in a small space will get hot, for reasons detailed below. The heat is used to boil water into high-pressure steam, which then turns a turbine and generator (Figure 15.12). Note that a nuclear fission plant has much in common with a coal-fired power plant, as evidenced by the similarity of Figure 15.12 to Fig. 6.2 (p. 95). Only the source of heat is much different in origin.
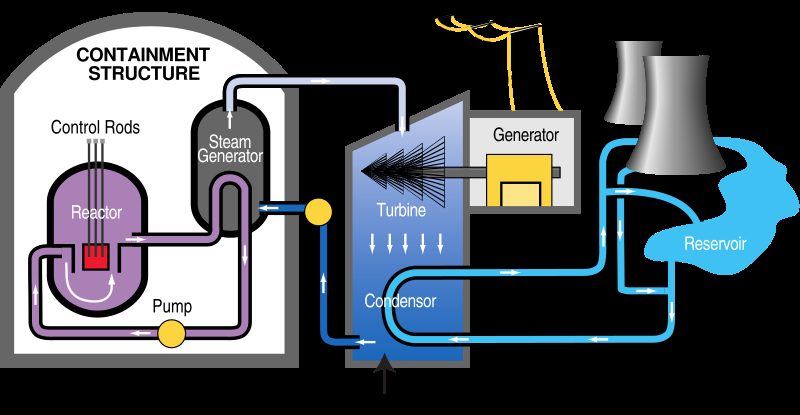
Figure 15.12:Typical nuclear power plant design, bearing much resemblance to the generic scheme from Figure 6.2. Details on the reactor core will follow in Section 15.4.4. Source: TVA.
15.4.1 The Basic Idea
Out of all the nuclides, three are amenable for use in a fission reactor. Two are isotopes of uranium: U and U; and one is plutonium: Pu. Of these, only U is found in nature, so we will concentrate on this one, returning later to the other two when we talk about breeder reactors in Section 15.4.4.2.
What makes U (and the other two) special is that a slow[23] neutron— one just bumping around at a speed governed by the local temperature, and thus called a thermal neutron—can walk up to and stick[24] to the nucleus and cause it to split into two large chunks—depicted in Figure 15.13. Other nuclei would not break up, just accepting the new neutron and possibly converting a neutron to a proton via decay.

Figure 15.13:Fission schematic for showing one of many possible outcomes—
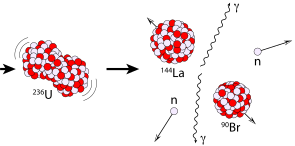
When the nucleus breaks up, the pieces fly out at high speed, carrying kinetic energy that will be deposited in the local material as they bump their way to a halt. Gamma rays[25] are also released. By catching all of this energetic output, the surrounding material gets very hot and can be used to make steam.
15.4.2 Chain Reaction
As we have seen, in order to get fission to happen, we need U and some wandering neutrons. Once fission commences, the breakup of the nucleus usually “drips” a few spare neutrons, like crumbs left after cutting a piece of bread. The left-over neutrons provide a replenished source of neutrons ready to initiate more fission events. Now the door is open for a chain reaction, in which the neutrons produced by the fission events are the very things needed to stimulate additional fission events.
When the nucleus splits, any extra neutrons come out “hot” (high speed), which tend to bounce off uranium nuclei without sticking. They need to be slowed down, which is accomplished by a moderator: basically light atoms[26] that can receive the neutron impact as a sort of damping medium. Then the main trick is to prevent a runaway that could occur if too many neutrons become available; in which case it’s a party that can get out of control. So nuclear plants employ control rods containing materials particularly effective at absorbing (trapping) neutrons. The colors of the lower halves of some squares in the Chart of the Nuclides (Figure 15.4) indicate neutron capture cross section. Boron ([10] ) is aB favorite choice to soak up neutrons and tame (or even halt) the reaction. The goal is to maintain a chain reaction that produces a net balance of exactly one unabsorbed slow neutron per fission event, available to attach itself to a waiting U nucleus.
15.4.3 Fission Accounting
The nucleus (uranium in the present discussion) always breaks up into two largish pieces, possibly accompanied by a few liberated spare neutrons. Because of the way the track of stable elements curves on the Chart of the Nuclides, the resultant pieces are likely to be neutron rich, to the right of the stable nuclei. To understand this, refer to Figure 15.14 and the associated caption.
The math always has to add up: nucleons are not created or destroyed during a fission event. They just rearrange themselves, so the total number of neutrons stays the same, as does the total number of protons. After the split, decays will carry out flavor changes, but we’ll deal with that part later.
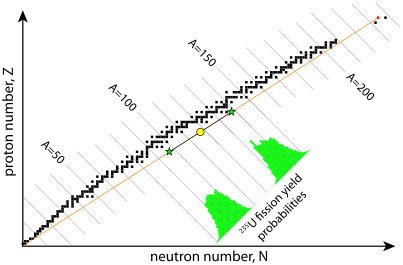
Figure 15.14:Fission of square, upper right) tends to produce two neutron-rich fragments. If it split exactly in two, the result would lie at the midpoint
Table 15.6:Possible outcomes for Example 15.4.1 if we set one of the daughter particles to be bromine-90, forcing the other daughter to be lanthanum. Different isotopes of lanthanum will result for differing numbers of spare neutrons left after the break-up (last row).
| 235 U | 90 Br | 146 La | 145 La | 144 La | 143 La | |
|---|---|---|---|---|---|---|
| 235 | 90 | 146 | 145 | 144 | 143 | |
| 92 | 35 | 57 | 57 | 57 | 57 | |
| 143 | 55 | 89 | 88 | 87 | 86 | |
| n | 1 | 0 | 1 | 2 | 3 |
Being a probabilistic (random) process, each fission can result in a large set of possible “daughter” nuclei—only one set of which was explored in Example 15.4.1. As long as the masses all add up, and the two-hump probability distribution in Figure 15.14 is respected, anything goes. In other words, we have no control over exactly what pieces come out. Figure 15.15 provides a graphic illustration of four different possible pairs of daughter fragments. The counting requirement is satisfied by having the products located diametrically opposite from the U midpoint (yellow circle). The positions of the stars will distribute along values according to the probability distribution (multi-colored histogram). Note the completely distinct peaks, conveying that virtually every fission event results in just two fragments: one bigger and one smaller. At least that aspect of fission is predictable, even if we can’t say precisely which nuclei will be left after an individual fission event.
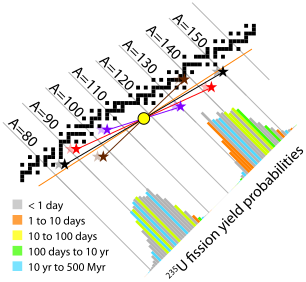
Figure 15.15:Various fission product outcomes are possible, indicated here by four sets of colored star pairs and connecting lines. The average position of each pair is the yellow circle (the stars are diametrically opposite the circle), which guarantees that the total number of neutrons and protons is unchanged from the parent nucleus to the daughter nuclei. To the extent that additional neutrons are left behind like crumbs, the stars will displace to the left of their indicated positions a bit, as hinted by the lighter-shaded “ghost” stars, whose offsets from the nominal star positions will also vary depending on how many neutrons are left out of the two final fragments. The coloring of the histogram indicates radioactive lifetime for the decay chain of a neutron-rich fragment at each mass number, matching the half-life color scheme used in Figure 15.4.
Let us now examine the energetics, using the result from Example 15.4.1, in which U breaks into Br and La, plus two spare neutrons.[28] To be explicit, the reaction we will trace is
Table 15.7:Mass details of Eq. 15.2, tracking before and after masses in both a.m.u. and MeV units. The input mass of around 236 a.m.u. is reduced by about 0.185 a.m.u., or 0.08%.
| Constituent/Stage | mass (a.m.u.) | mass (MeV |
|---|---|---|
| 235 | ||
| U | 235.04392 | 218,942.0 |
| n | 1.00866 | 939.6 |
| input mass | 236.05259 | 219,881.6 |
| 90 | ||
| Br | 89.93069 | 83,769.9 |
| 144 | ||
| La | 143.91955 | 134,060.2 |
| 2n | 2.01733 | 1,879.1 |
| output mass | 235.86757 | 219,709.3 |
| mass change | 0.18502 | 172.3 |
The masses of each piece, according to the Chart of the Nuclides, appear in Table 15.7. Again, we find that the mass sums don’t equal: the final parts are lighter than the inputs. The fission managed to lose 0.185 a.m.u. of mass, corresponding to 172 MeV of energy (via ; see Example 15.3.1). That’s a 0.08% change in the mass, and converts to an energy density of roughly 17 million kcal/g, making the process over a million times more energy–dense than our customary kcal/g chemical energy density. See Box 15.3 for an example of how to compute this.
We can take a graphical shortcut to all of Section 15.4.3, which hopefully will tie things together in an instructive way.
The graphical method got us pretty close with little work, and hopefully led to a deeper understanding of what is going on. The rest of this paragraph explains the discrepancy, but should be considered nonessential reading. The fission process typically results in a few spare neutrons. Each left-over (unbound) neutron deprives us of at least 8 MeV in unrealized binding potential,[33] and the subsequent decays from the neutron-rich daughter nuclei to stable nuclei also release energy not accounted in Table 15.7. Both of these contribute to the shortfall in comparing 172 MeV to 210 MeV, but even without this, we got a decent estimate just using the graph in Figure 15.10.
15.4.4 Practical Implementations
As we saw above, nuclear fission involves getting fissile nuclei—generally U—to split apart by the addition of a neutron. The following criteria must be met:
presence of nuclear fuel U);
presence of neutrons, provided as left-overs from earlier fission events;
a moderator to slow down neutrons that emerge from the fission events at high speed;
a high enough concentration of nuclear fuel that the slowed-down spare neutrons are likely to find fissile nuclei;
neutron absorbers in the form of control rods that can be lowered into the reactor and act as the main “throttle” to set reaction speed (thus power output), and also prevent a runaway chain reaction;
a containment vessel to mitigate radioactive particles (gamma rays, high-speed electrons and positrons) from escaping to the environment.
Figure 15.16 shows a typical configuration.
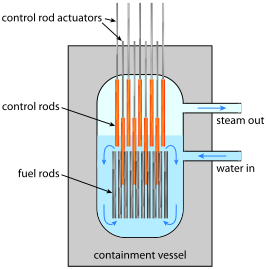
Figure 15.16:Typical boiling water reactor design. A thick-walled containment vessel
In the design of Figure 15.16, called a boiling water reactor, the water acts as both the neutron moderator and the thermal conveyance medium. Nuclear fuel (uranium) is arranged in fuel rods, providing ample surface area and allowing water to circulate between the rods to slow down neutrons and carry the heat away. Neutron-absorbing control rods— usually containing boron—set the reaction speed by lowering from the top.[34] An emergency set of control rods can be dropped into the core in a big hurry to shut down the reactor instantly if something goes wrong. When the emergency rods are in place, neutrons have little chance of finding a U nucleus before being gobbled up by boron.
As of 2019, the world has about 455 operating nuclear reactors, amounting to an installed capacity of about 400 GW.[35] The average produced power— not all are running all the time—was just short of 300 GW. The thermal equivalent would be approximately three times this, or 1 TW out of the 18 TW we use in the world. So nuclear is a relevant player. See Table 15.8 for a breakdown of the top several countries, Fig. 7.7 (p. 114) for nuclear energy’s trend in the world, and Fig. 7.4 (p. 112) for the U.S. trend.
Table 15.8:Global nuclear power in 2019 [101], listing number of operational plants, installed capacity, average generation for 2019 (Japan currently has stopped a number of its reactors), percentage of electricity (not total energy), and fraction of global production (these 7 countries accounting for over 75%). Notice the close match between number of plants and GW installed for most countries, indicating that most nuclear plants deliver about 1 GW.
| Country | # Plants | GW inst. | GW avg. | % elec. | global share (%) |
|---|---|---|---|---|---|
| U.S. | 95 | 97 | 92 | 20 | 31 |
| France | 56 | 61 | 44 | 71 | 15 |
| China | 49 | 47 | 38 | 5 | 13 |
| Russia | 38 | 28 | 22 | 20 | 8 |
| Japan | 33 | 32 | 8 | 8 | 3 |
| S. Korea | 24 | 23 | 16 | 26 | 5 |
| India | 22 | 6 | 5 | 3 | 2 |
| World Total | 455 | 393 | 295 | 11 | 100 |
Nuclear plants only last about 50–60 years, after which the material comprising the core becomes brittle from exposure to damaging radioactivity and must be decommissioned. The median age of reactors in the U.S. is 40 years, and all but three are over 30 years old. Additional challenges will be addressed in the sections that follow.
When nuclear energy was first being rolled out in the 1950s, the catch phrase was that it would be “too cheap to meter,” a sentiment presumably fueled by the stupendous energy density of uranium, requiring very small quantities compared to fossil fuels. The reality has not worked out that way. Today, a 1 GW nuclear power plant may cost $9 billion to build [102]. That’s $9 per Watt of output power, which we can compare to the cost of a solar panel, at about $0.50 per W (Fig. 13.16; p. 225), or utility-scale installation at $1 per Watt [89]. While it seems that solar[36] wins by a huge margin, the low capacity factor of solar reduces average power output to 10–20% of the peak rating, depending on location. Meanwhile, nuclear reactors tend to run steadily 90% of the time—the off-time used for maintenance and fuel loading. So nuclear fission costs about $10 per delivered Watt, while solar panels are $2.5–5 per delivered
Watt and installed utility-scale systems are $5–10 per Watt. In short, nuclear power is not an economic slam dunk.
15.4.4.1 Uranium
So far, we have ignored a crucial fact. Only 0.72% of natural uranium on Earth is the fissile U flavor. The vast majority, 99.2745%, is the benign U.[37] The ratio is about 140:1, so for every U atom pulled out of the ground, 140 times this number of uranium atoms must be extracted. The origin of the disparity is a story of astrophysics and eons, covered in Box 15.4.
Uranium is not particularly abundant. Table 15.9 provides a sense of how prevalent various elements are in the earth’s crust. Uranium is more abundant than silver, but the useful U isotope is four times rarer than silver, and only about 5 times as abundant as gold. Proven reserves of uranium [103] amount to 7.6 million (metric) tons available, and we have used 2.8 million metric tons to date. The implication is that we could continue about 3 times longer than we have gone so far on proven reserves. But nuclear energy has played a much smaller role than fossil fuels, so maybe this isn’t so much.
Evaluating the uranium reserves in energy terms is the most revealing
Table 15.9:Example material abundances in the earth’s crust, in parts per million by mass.
| Element | Abund. | Element | Abund. | Element | Abund. |
|---|---|---|---|---|---|
| silicon | 282,000 | carbon | 200 | thorium | 9.6 |
| aluminum | 82,300 | copper | 60 | uranium | 2.7 |
| iron | 56,300 | lithium | 20 | silver | 0.075 |
| 235 | |||||
| calcium | 41,500 | lead | 14 | U | 0.02 |
| titanium | 5,650 | boron | 10 | gold | 0.004 |
approach. First, we take 0.72% of the 7.6 million tons available to represent the portion of uranium in the form of U. Enrichment (next section) will not separate all of the U, and the reactor can’t burn all of it away before the fuel rod is essentially useless. So optimistically, we burn half of the mined U in the reactor. Multiplying the resulting 27,300 tons of usable U by the 17 million kcal/g we derived earlier yields a total of J. Table 15.10 puts this in context against fossil fuel proven reserves from page 132. We see from this that proven uranium reserves give us only 20% as much energy as our proven oil reserves, and about 5% of our total remaining fossil fuel supply. If we tried to get all 18 TW from this uranium supply, it would last less than 4 years! This does not sound like a salvation.
Table 15.10:Proven reserves, in energy terms.
| Fuel | 1021 J |
|---|---|
| Coal | 20 |
| Oil | 10 |
| Gas | 8 |
| 235 | |
| U | 2 |
Proven uranium reserves would last 90 years at the current rate of use, so really it is in a category fairly similar to that of fossil fuels in terms of finite supply. To be fair, proven reserves are always a conservative lower limit on estimated total resource availability. And since fuel cost is not the limiting factor for nuclear plants, higher uranium prices can make more available, from more difficult deposits. Still, even a factor of two more does not transform the story into one of an ample, worry-free resource.
15.4.4.2 Breeder Reactors
In its native form, U is too dilute in natural uranium—overwhelmingly dominated by U—to even work in a nuclear reactor. It must be enriched to 3–5% concentration to become viable.[40] Enrichment is difficult to achieve. Chemically, U and U behave identically. The masses are so close—just 1% different—that mechanical processes have a difficult time differentiating. Centrifuges are commonly used to allow heavier U to sink faster[41] than U. But it’s inefficient and usually requires many iterations to work up higher concentrations. The process is also lossy, in that not all of the U finds its way to the enriched pile.[42]
But what if we could use the bulk uranium, U, in reactors and not only save ourselves the hassle of enrichment, but also gain access to 140 times more material, in effect? Doing so would turn the proven reserves of uranium into about 7 times more energy supply than all of our remaining fossil fuels. Well, it turns out that despite its not being one of the three fissile nuclei, we can convert[43] U into the fissile Pu the following way.
A U may absorb a wandering neutron to become U.
U, whose half life is 23.5 minutes, undergoes to become Np in short order.
Np also undergoes with a half life of 2.4 days to become fissile Pu.
Figure 15.17 highlights this process in a simplified region of the Chart of the Nuclides, while Figure 15.18 shows complete details for the entire region around the fissile materials—the ones with red isotope names—which can be used to track the sequence outlined above.
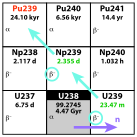
Figure 15.17:Breeder route to
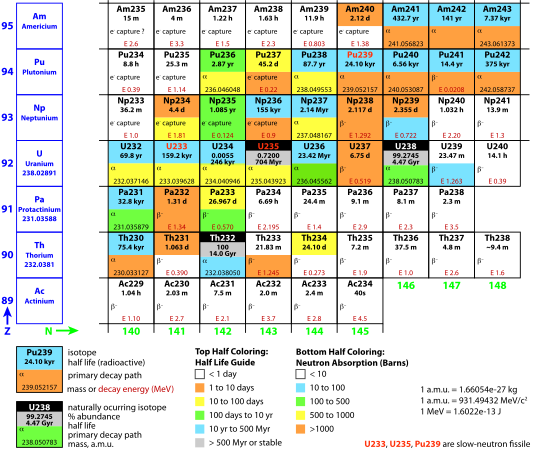
Figure 15.18:Chart of the Nuclides in the fission region. See also Figure 15.4 for the lower-left corner.
The result is that sterile U can be turned into fissile Pu that can be used in fission reactors. This process of transmuting an inert nucleus into a fissile one is called breeding, and is how we get any plutonium at all.[44] A nuclear reactor is a great place to introduce U to neutrons: both are already in attendance. In fact, breeding happens as a matter of course in a nuclear reactor: it is estimated that one-third of the fission
energy in ordinary nuclear reactors comes from plutonium breeding and subsequent fissioning—without any extra effort. Special reactor designs enhance plutonium production, allowing the fuel rod to be “harvested” for plutonium. Usually, the plutonium is destined for use in weapons, but in principle reactors could be designed to efficiently produce and use plutonium from the U feedstock. Downsides will be addressed in Section 15.4.6 on weapons and proliferation.
15.4.5 Nuclear Waste
As we saw in our description of the fission process, the fragments distribute over a range of masses in a randomized way (Figure 15.15). The results are generally neutron-rich, and will migrate toward stable elements via decays over the ensuing seconds, hours, days, months, and years. Some will go fast, and some will take ages to settle, depending on half-lives. Radioactive waste is dangerous to be around because the high-energy particles (like sub-atomic “bullets”) spewing out in all directions can alter DNA, leading to cancer and birth defects, for instance.
The lighter of the two fission fragments has a 59% chance of landing on a stable nucleus within a day or so. For the heavier fragment, it’s a 45% chance. The rest get hung up on some longer half-life nuclide, and could remain radioactive for a matter of weeks or in some cases millions of years. The colors in the fission probability histograms in Figure 15.15 provide a visual guide for the mass numbers that reach stability promptly (gray) vs. those that get hung up for a long time (blue is more than 10 years). For example, the histogram element at is blue because Sr—discussed below—stands in the way of a fast path to stability.
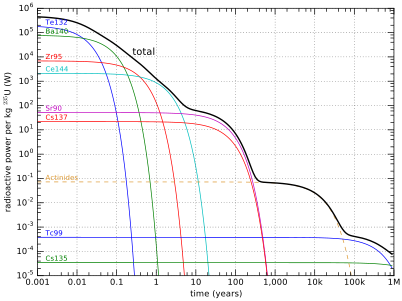
Figure 15.19:Decay activity of fragments
Figure 15.19 shows how the fission decays play out over time. For the first month or so out of the reactor, the spent fuel is really “hot” radioactively, but falls quickly as Zr and then Ce dominate around one year out. At about 5 years, the pair of Sr and Cs begin to dominate the output for the next few-hundred years. Some of the products survive for millions of years, albeit at low levels of radioactive power. In addition to the daughter fragments, uranium in the presence of neutrons transmutes into neptunium, plutonium, americium, and curium via neutron absorption and subsequent decays, represented approximately and collectively in Figure 15.19 by a dashed curve labeled Actinides.[47]
The bottom line is that fission leaves a trash heap of radioactive waste that remains at problematic levels for many thousands of years. When nuclear reactors were first built, they were provisioned with holding tanks—deep pools of water—in which to place the waste fuel until a more permanent arrangement could be sorted out (Figure 15.20). We are still waiting for an adequate permanent solution for waste storage, and the “temporary” pools are just accumulating spent fuel. Transporting the spent fuel is hazardous—in part because it could fall into the wrong hands and be used to make “dirty” bombs—and no one wants a nuclear waste facility in their backyard, making the problem politically thorny. On the technical side, it is difficult to identify sites that are geologically stable enough and have little chance of groundwater contamination. Underground salt domes offer an interesting possibility, but political challenges remain daunting.
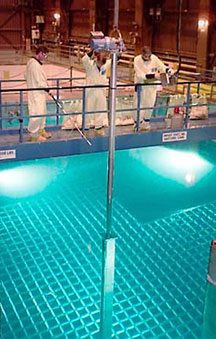
Figure 15.20:A spent fuel rod being lowered into a storage grid in a pool of water at a nuclear power plant. Source: U.S. DoE.
15.4.6 Nuclear Weapons and Proliferation
Nuclear bombs are the most destructive weapons we have managed to create. The first bombs from the 1940s were based on either highly enriched U or on Pu. For uranium bombs, the idea is shockingly simple. Two separate lumps of the bomb material are held apart until detonation is desired, at which point they are slammed together.[48] It’s not the collision that creates the explosion, but a runaway process based on having a high concentration of fissile material and no neutron absorbers present to control the resulting chain reaction. The concept is critical mass. The combined lump exceeds the critical mass, and explodes.[49]
As simple as nuclear weapons are to build, the bottleneck becomes obtaining fissile material. Plutonium does not exist in nature, since its 24,100 yr half-life means nothing is left over from the astrophysical processes that gave us uranium and thorium (Box 15.4). We only still have the latter two thanks to their long half lives. So fissile material has to start with uranium. But as we have seen, natural uranium is only 0.72% fissile U). In order to be explosive, the uranium must be enriched to at least 20% U, and generally much higher (85%). Reactor fuel, at 3–5% U will experience meltdown if the critical mass is exceeded, but will not explode. Enrichment is technically difficult, and attempts to acquire and enrich uranium are monitored closely. Often we hear of countries pursuing uranium enrichment, claiming that they are only interested in domestic energy production—a peaceful purpose. And it is true that the first step in nuclear power generation is also enrichment. So it is very difficult to ascertain true intentions. Once a country has the ability to enrich uranium enough for a nuclear plant, they can in principle keep the process running longer to arrive at weapons-grade 235U.
While we worry about U falling into the wrong hands, perhaps more disturbing is Pu. Having a much shorter half-life than U (24 kyr vs. 704 Myr), it is more dangerous to handle.[50] But plutonium is otherwise easy to deal with, since it requires no enrichment and can be chemically separated to achieve purity. It is the material of choice for nuclear weapons.
Serious pursuit of breeder reactors effectively means manufacturing lots of plutonium, leading to proliferation of nuclear materials: it becomes harder to track and keep away from mal-intentioned groups. The world becomes more dangerous under a breeder program. Thorium breeding (Box 15.5) is less risky in this regard because the U prize is mixed with a ridiculously dangerous U isotope that puts plutonium to shame, so working with it is pretty deadly, which may deter would-be pursuit of this material by rogue groups.
A related concern involves proliferation of the abundant radioactive waste from fission plants, which could be mixed into conventional explosives[51] to radioactively contaminate a city or local region—poisoning
water, food, and air. In short, nuclear fission carries many perils on a number of fronts.
15.4.7 Nuclear Safety
A properly operating nuclear facility actually emits less radioactivity than does a traditional coal-fired power plant! As is true for many materials mined from the ground, coal contains some small amount of radioactive elements found in the earth’s crust: principally thorium, uranium, and potassium. Lacking any shielding or protection, the exhaust from a coal plant distributes these products into the atmosphere. Nuclear plants, by contrast, have no exhaust,[52] and carefully control the exposure to radioactivity.
However, things can go wrong. The U.S. had a scare in 1979 when a six-month-old nuclear plant at Three Mile Island in Pennsylvania (Figure 15.21) suffered a loss-of-cooling incident that resulted in severe damage to (meltdown of) the core. But the containment vessel held and no significant radioactivity was released to the environment. Workers at the plant received a dose equivalent to an extra 100 days of natural[53] exposure. So we dodged a bullet.
Chernobyl was not so lucky in April 1986 when an ill-conceived test went sideways and resulted in an actual explosion of the core. This scenario was previously thought to be impossible, but it was a steam explosion, not a nuclear blast—so more like a “dirty bomb” that scattered radioactive material across the region. Thirty-one people died in the immediate aftermath, and about 200 people got acute radiation sickness. It is estimated that in the long term, 25,000 to 50,000 additional cancer cases will result, but this number is controversial and it is hard to tease Chernobyl-caused cancer/deaths apart from the much larger number of background cancer cases. The town of Chernobyl is still abandoned and only recently has begun to allow strictly limited incursions.
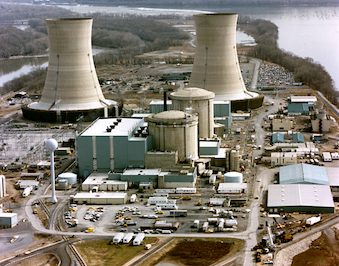
Figure 15.21:Three Mile Island nuclear plant in Pennsylvania. The two reactor cores are in the foreground of the larger cooling towers behind. Source: U.S. DoE.
The most recent major accident was the Fukushima Daiichi plant in Japan following the Sendai earthquake in March 2011, resulting in the evacuation of 200,000 people and agricultural loss. The earthquake caused the three operating reactors to shut down (safely), while diesel-fueled generators ran to power pumps maintaining cooling flow over the hot fuel rods. The core of a reactor is still very hot after fission stops and continues to generate heat as daughter nuclei decay, so cooling flow must be maintained or the core can melt. The ensuing tsunami[54] ruined the plan to keep the cores cool, as the generator rooms flooded, causing the cooling flow to fail. The cores of all three reactors melted down and hydrogen gas explosions created a major release of radioactivity. Perhaps in contrast to the Chernobyl plant, Fukushima was designed by General Electric and operated by a well-educated high-tech society. No one is exempt from risk when it comes to nuclear reactors.
15.4.8 Pros and Cons of Fission
Collecting the advantages and disadvantages of fission, we start with the positive aspects:
Nuclear fuel has extraordinary energy density, about a million times better than chemical energy density;
Nuclear fission is proven technology providing a substantial fraction of electrical energy at present;
Life-cycle CO emissions for nuclear fission is only 2% that of traditional fossil fuel electricity [68];
Breeder reactors could provide thousands of years of fuel, by way of uranium and thorium (undeveloped as yet).
And for the downsides:
Radioactive waste is dangerous for thousands of years, and no clear solution to its disposal or long-term storage has emerged.
Conventional uranium fission has limited fuel supply,[55] measuring in decades;
Breeder reactors exacerbate the waste issue and promote proliferation of nuclear materials;
Development of nuclear energy technology prepares an easy step to immensely destructive nuclear weapons;
Accidents happen even to the best-managed reactors, the consequences often being severe for a region.
Nuclear fission is a complex topic that has compelling advantages and worrisome faults. Not surprisingly, attitudes are highly mixed. One survey [104] indicates that adults in the U.S. oppose building more nuclear plant by a slim 51% to 45%, while scientists overall favor advancing nuclear plants by a 2:1 margin,[56] and physicists surveyed favored nuclear by 4:1. Scientists are much more likely to view climate change as a serious threat than the U.S. population as a whole, and therefore are likely to be attracted to energy resources that do not emit CO. Of the physicists surveyed, it would be a mistake to assume that even the majority know the topic as thoroughly as it is covered in this chapter—given the degree of specialization within the field. Among those who understand the topic thoroughly[57] it is almost certain you’d find a healthy split: those for whom the perils outweigh advantages, and those who are concerned enough about climate change to accept the “lesser of two evils,” and/or who are enthusiastic about the technology as a glowing example of our mastery over nature’s hidden secrets.
15.5 Fusion
Given that fission has problems of finite uranium supply, radioactive waste, proliferation and weapons, and safety issues, its future is uncertain. Fusion, on the other hand, is not plagued by most of these issues. It’s main problem is that it is incredibly difficult and has been in the research stage for 70 years. Other than that, it has many (virtual) virtues. To be clear, the world does not have and never has had an operational fusion power plant. It may belong to the future, but is not guaranteed to ever become practical.
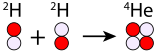
Figure 15.22:Fusion concept: helium from deuterium.
First, the basics. We have alluded to the fact that fusion builds from the 1
small to the big. Putting four H nuclei together, at 1.007825 a.m.u. each 4
and forming He at 4.0026033 a.m.u. leaves a difference of 0.0287 a.m.u.— 0.7% of the total mass—which amounts to 153 million kcal/g.[58] This is almost ten times as large as the amount for fission (17 million kcal/g; Box 15.3), making it ten-million times more potent than chemical reactions. Recall that fusion’s better performance can be related to the steepness of the left-hand-side of the binding-energy-per-nucleon curve of Figure 15.10.
What makes fusion so difficult is that getting protons to stick together is incredibly hard. Their electric repulsion is so strong that they need to be approaching each other at a significant fraction of the speed of light (about 7%) in order to get within reach of the strong nuclear force that takes over at distances smaller than about 10-15 m. The corresponding temperature is a billion degrees.[59] Even the center of the sun is “only” 16 million degrees. The sun has the advantage of being enormous, though. So even at a comparatively chilly 16 million degrees, some rare protons by chance will be going extra fast and have enough oomph to overcome the repulsion and stick together. It’s like winning the lottery against very long odds, but the sun is large enough to buy ample tickets so the process still happens often enough.[60] We don’t have such a luxury in a terrestrial laboratory setting, so we need higher temperatures than what exists in the center of the sun! 2 1
Using H nuclei (deuterons, labeled D) instead of H (protons) in what is called a D–D fusion reactor, allows operation at 100 million degrees 3
instead of 1 billion. And colliding one deuteron with a triton[61] ( H nucleus, labeled T; 12.3 year half-life), only requires 45 million degrees for a D–T fusion reactor. For this reason, only D–T fusion is currently pursued.
For all three types, the relevant reactions[62] are:
p p: H H H H He MeV
D T: H H He n MeV
But the 45 million degrees required for D–T fusion is still frightfully hard to achieve. No containers will withstand temperatures beyond a few thousand degrees. Containment—or confinement—is the big challenge then. The multi-million degree plasma[63] cannot be permitted to touch the
walls of the chamber, despite its constituents zipping around at speeds around 1,000 km/s! This feat can be sort-of managed via magnetic fields bending the paths of the fast-moving charged particles into circles. But turbulence in the plasma plagues attempts to confine the D–T mixture at temperatures high enough to produce fusion yield.
If a 45 million degree plasma could be confined in a stable fashion, the heat generated by the reactions[64] could be used to make steam and run a traditional power plant—replacing the flame symbol in Fig. 6.2 (p. 95) with something much fancier. The scheme, therefore, requires first heating a plasma to unbelievable temperatures in order for the plasma to self-generate enough additional heat through fusion that the game shifts to one of keeping the plasma cool enough to produce a steady rate of fusion without blowing itself out. In this scenario, the heat extracted from the cooling flow makes steam. It’s the most elaborate[65] possible source of heat to boil water. It may be a bit like working hard to develop a light saber whose only use will be as a letter opener.
15.5.1 Fuel Abundance
Deuterium—an isotope of hydrogen—is found in 0.0115% of hydrogen,[66] which means that the occasional HO molecule is actually HDO.[67] Therefore sea water is chock-full of deuterium. The global 18 TW appetite would need 3 deuterium atoms per year for D–D or 2 each of deuterium and tritium atoms per year for D–T. Running with this latter number for the comparatively easier D–T reaction, we would need to process 9 water molecules each year to find the requisite deuterium. This corresponds to 26 million tons of water, which is a cubic volume about 300 m on a side. Yes, that’s large, but the ocean is larger. Also, it corresponds to a volume of 0.16 billion barrels per year, which is about 200 times smaller than our annual oil consumption. Thus, the volume required should be not at all challenging.[68] The ocean volume is 60 billion times larger than our 300-m-sided cube, implying that we have enough deuterium for 60 billion years. The sun will not live that long, so let’s say that we have sufficient deuterium on Earth.
Tritium, however, is essentially nowhere to be found, as it has a half-life of 12.3 years. We can generate tritium by adding a neutron to lithium and stimulating an decay. So the question moves to how much lithium we have. Proven reserves are at about 15 million tons, currently produced at about 30,000 tons per year.[69] We would need 2,300 tons[70] of lithium per year to meet our 2 tritium atom target (for 18 TW). In the absence of competition[71] for lithium resources, the associated R/P ratio timescale is 6,500 years. Yes, that is a comfortably long time, but not eons. The thought is that this would buy time to solve the D–D challenge.
15.5.2 Fusion Realities
It is clear why people get excited by fusion. It seems like an unlimited supply that can last thousands if not billions of years at today’s rate of energy demand. For some perspective, think about what else we know that lasts billions of years. We already have a giant fusion reactor parked 150 million kilometers away that requires no mining, servicing, or any attention whatsoever. In this sense, the sun is essentially as inexhaustible as fusion promises to be, but already working and free of charge. Photovoltaic panels plus batteries work today and have already shown a possible path to eternal energy. The author built his own off-grid solar setup on a budget that’s tiny compared to the fusion enterprise.
As for the fusion enterprise, an effort called ITER (Figure 15.23) in southern France is an international effort currently constructing a plasma confinement machine that aims to commence experimental D–T fusion by the year 2035 via occasional 8-minute pulses of 0.5 GW thermal power. This machine is a stepping stone that is not designed to produce electricity. Estimates for construction cost range from $22 billion to $65 billion. By comparison, a nuclear fission plant costs $6–9 billion to build. Admittedly, the first experimental facility is going to cost more, but it is hard to imagine fusion ever being a real steal, financially. Even if the fuel is free, so what? Solar is the same.
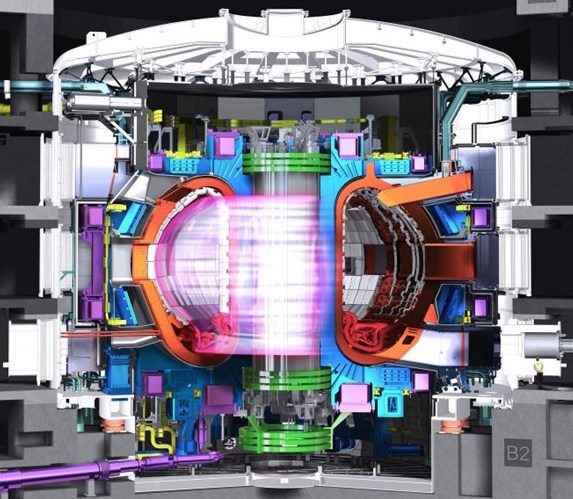
Figure 15.23:ITER tokamak cut-away where the plasma would be created. The white outer chamber is the size of a six-story building. From the ITER Organization.
An effort in the U.S. called the nuclear ignition facility (NIF) is pursuing a different approach to fusion research: attempting to implode a tiny sphere of D–T mixture by blasting it with 192 converging laser beams, crushing it to enormous pressure exceeding that in a star’s interior, leading to an explosive release of heat. The building, mostly taken up by gigantic lasers, is the size of three football fields and has so far cost something to the tune of $10 billion. Again, this experimental facility is not provisioned to harness any net energy gain[72] to create electricity.
Let’s say that by the year 2050, we will have mastered the art and can build a 1 GW electrical-output[73] fusion plant for $15 billion. That’s $15 per Watt of output, which we can compare to a present-day solar utility-scale installation cost of $1 per peak Watt [89]. Applying typical capacity factors[74] puts fusion at twice what solar costs already, today.
Fusion is therefore a complicated and not particularly cheap way to generate electricity. Meanwhile, we are not running terribly short on renewable ways to produce electricity: solar; wind; hydroelectric; geothermal; tidal. Liquid fuels for transportation represent a greater and more pressing challenge, and fusion does not directly address this aspect any better than other options for electrical production. Fusion is by far the most complex power generation scheme we have ever attempted, evidenced by the 70 year effort to bring it to fruition that is still underway. How many physics PhDs will it take to keep a fusion plant running? Sometimes, we get stuck pursuing a flawed vision of the future, and have trouble reevaluating our options. Imagine being a middle-aged physicist or engineer in the 1950s. In your lifetime, you would have seen the advent of the car, airplane, radio, television, nuclear fission, among a blur of other technology advances. The next frontier was obviously fusion, so let’s crack that one! At this point, 70 years later, maybe we should ask: why?
And let’s point out that fusion is not without its waste challenges. It is still a radioactive environment, albeit not one that produces dangerous 4
direct products ( He is okay!). It does involve a radioactive fuel source (tritium), and it does embed the containment vessel with high energy particles and neutrons that over time compromise the integrity of the vessel so that it must be discarded as a radioactively-charged hunk of metal.[75] By comparison, solar, wind, and other renewable sources based on the sun have no such problems. All of the nastiness is created in the sun, and stays in the sun.
15.5.3 Pros and Cons of Fusion
Collecting the advantages and disadvantages of fusion, we start with the positive attributes:
Fusion would enjoy an inexhaustible supply of deuterium, easily accessed, outlasting the sun;
The fusion reactor would serve as a heat source for tried-and-true steam-driven power plant technology.
And now the not-so-good aspects:
Stable plasmas are exceedingly hard to generate at the requisite temperatures;
70 years of effort have not yet borne fruit as an energy supply;
Tritium is not available, and must be fabricated from a limited supply of lithium;
Fusion still contends with radioactive fuel (tritium) and a containment vessel that is radioactively contaminated. The smaller number of positive points is not in itself an indicator of imbalance, since the first point is huge. One elephant can balance dozens of kids on a playground see-saw.
15.6 Upshot on Nuclear
Nuclear fission is a real thing: it can and does produce a significant fraction the world’s power. A number of substantive challenges stand in the way of scaling up significantly.[76] For conventional nuclear fission as it has been practiced thus far, the proven reserves of uranium only last 90 years at today’s rate of use, and less than 4 years if we tried to get all 18 TW from fission. Radioactive waste is an unsolved problem that persists for hundreds to thousands of years. Breeder programs can extend the resource by large factors (into the 500 or 1,000 year range under an 18 TW nuclear-breeder effort). But proliferation and bomb dangers become more pronounced—not to mention an even more pressing waste issue and greater accident rates given the profusion of operating reactors. It can be difficult to get excited about a nuclear future. It is very cool that we figured out how to do it. But just because we can do something does not mean it is a good idea to scale it up.
Fusion is a harder prospect to pin down. At present, it is not on the table, having never been demonstrated in a viable reactor capable of producing commercial-scale electricity. But even if we did manage it, how could it compete economically, as complex as it is? Even if the fuel itself is free,[77] it may turn out to be the most expensive form of electricity we could muster. Fusion is not without radioactivity concerns, and placed side-by-side, solar can look a lot better—intermittency being the crippling drawback, necessitating storage.
Nuclear options cause us to grapple with the question: who are we? What is our identity? What are our aims, and where do we see ourselves going? Are we plotting a course for a Star Trek future, in which case it seems we have little choice but to adopt the highest-tech solutions. Or are we aiming for a more modest future more aligned with natural ecosystems on Earth? So even if we can do something, does it mean we’re obligated to? Sometimes the costs may be too high.
15.7 Problems
If an atom were scaled up to be comparable to the extent of a mid-sized campus, how large would the nucleus be, and what sort of familiar object would be similar?
In parallel to Example 15.1.1, what are all the ways to label the radioactive isotope carbon-14?
How many neutrons does the isotope Fe contain?
Use the information in the boxes for and in Figure 15.4 to determine the weighted composite mass of a natural blend of carbon—showing work—and compare this to the number in the left-most box for carbon in the same figure.
In Figure 15.4, what are the only mass numbers, , for which no stable nuclei exist?
What are the only three long-lived radioactive isotopes in the portion of the Chart of the Nuclides appearing in Figure 15.4, and which one lives the longest (how long)?
Cosmic rays impinging on our atmosphere generate radioactive from nuclei.[78] These atoms soon team up with oxygen to form CO, so that plants absorbing CO from the air will have about one in a trillion of their carbon atoms in this form. Animals eating these plants[79] will also have this fraction of carbon in their bodies, until they die and stop cycling carbon into their bodies. At this point, the fraction of carbon atoms in the form of in the body declines, with a half life of 5,715 years. If you dig up a human skull, and discover that only one-eighth of the usual one-trillionth of carbon atoms are , how old do you deem the skull to be?
If a friend creates a nucleus whose half-life is 4 hours and gives it to you at noon, what is the probability that it will not have decayed by noon the following day?
In close analog to the half-lives of U and U, let’s say two elements have half lives of 4.5 billion years and 750 million years.[80] If we start out having the same number of each (1:1 ratio), what will the ratio be after 4.5 billion years? Express as :1, where is the larger of the two.
Control rods in nuclear reactors tend to contain [10], which hasB a high neutron absorption cross section.[81] What happens to this nucleus when it absorbs a neutron, and is the result stable? If not, track the decay chain until it lands on a stable nucleus.
If someone managed to create a B nucleus, what would its fate be? Track the decay chain on Figure 15.4—indicating the type of decay at each step—until it reaches stability, and indicate how long each step is likely to take.
A particular nuclide is found to have lost 3 neutrons and 1 proton after a decay chain. What combination of and decays could account for this result?
How would you qualitatively describe the overall sense from Figure 15.8 in terms of where[82] on the chart one is likely to see decay, decay, decay, and spontaneous fission?
In a year, an average American uses about 3 J of energy. How much mass does this translate to via ? Rock has a density approximately 3 times that of water, translating to about 3 mg per cubic millimeter. So roughly how big would a chunk of rock material be to provide a year’s worth of energy if converted to pure energy? Is it more like dust, a grain of sand, a pebble, a rock, a boulder, a hill, a mountain?
The world uses energy at a rate of 18 TW, amounting to almost 6 J per year. What is the mass-equivalent[83] of this amount of annual energy? What context can you provide for this amount of mass?
How much mass does a nuclear plant convert into energy if running uninterrupted for a year at 2.5 GW (thermal)?
A large boulder whose mass is 1,000 kg having a specific heat capacity of 1,000 is heated from to a glowing . How much more massive is it, assuming no atoms have been added or subtracted?
4
Replicate the computations in Table 15.5 for He, paralleling the Fe case in Example 15.3.2. Along the way, report the in kg and the corresponding in Joules, which are not in the table.
To illustrate the principle, let’s say we start with a nucleus whose mass is 200.000 a.m.u. and inject 1,600 MeV of energy to completely dismantle the nucleus into its constituent parts. How much mass would the final collection of parts have?
a) the exact same: 200.000 a.m.u. b) less than 200.000 a.m.u. c) more than 200.000 a.m.u.
Using the setup from Problem 19, compute the mass of the final configuration in a.m.u., after adding energy to disassemble the nucleus.
Referring to Figure 15.10, what is the total binding energy (in MeV) of a nucleus whose mass number is ?
Explain in some detail what happens if control rods are too effective at absorbing neutrons so that each fission event produces too few unabsorbed neutrons.
Which of the following is true about the fragments from a U fission event?
a) any number of fragments (2 through 235) can be produced b) a small number of fragments will emerge (2 to 5) c) two nearly identical fragments will emerge d) two fragments of distinctly different size will emerge e) the fission is an alpha decay: a small piece having is emitted
A particular fission of U n (total breaks up. One fragment has and , making it Xe. If no extra neutrons are produced in this event, what must the other fragment be, so all numbers add up? Refer to a periodic table (e.g., Fig. B.1; p. 387) to learn which element has the corresponding value, and express the result in the notation .X
Follow the same scenario as in Problem 24, except this time two neutrons are left out of the final fragments. What is the smaller fragment this time, if the larger one is still Xe?
Provide three examples of probable fragment size pairs (mass numbers, from the fission of U n, making up your own random outcome while respecting the distribution of Figure 15.15 in determining values. For the sake of this exercise, assume no extra neutrons escape the fragments.
Paralleling the graphical approach in Example 15.4.3 using Figure 15.10, what total energy would you expect to be released in a fusion 2 4
process going from two deuterium ( H) nuclei to He, in MeV?
Both nuclear and coal electric power plants are heat engines. What is the fundamental difference between these two, comparing Fig. 6.2 (p. 95) to Figure 15.12?
If a nuclear plant is built for $10 billion and operates for 50 years under an operating cost of $100 million per year, what is the cost to produce electricity, in $/kWh assuming that the plant delivers power at a steady rate of 1 GW for the whole time?
Since each nuclear plant delivers GW of electrical power, at thermodynamic efficiency this means a thermal generation rate of 2.5 GW. How many nuclear plants would we need to supply all 18 TW of our current energy demand? Since a typical lifetime is 50 years before decommissioning, how many days, on average would it be between new plants coming online (while old ones are retired) in a steady state?
Extending Problem 16 toward what actually happens, we know from Table 15.7 that the change in mass (which was close to 1 kg in Prob. 16) is only 0.08% of the U mass.[84] Furthermore, a fresh fuel rod is only 5% U—the rest being U. So how much total uranium[85] must be loaded into the reactor each year, if all the U is used up?
Problem 15 indicated that we need the mass-equivalent of fewer than 10 tons[87] of material to support the world’s annual energy
needs. But given realities that only 0.08% of mass is converted to energy in nuclear reactions, that only 0.72% of natural uranium is fissile U, and that only half of the U is retrievable[88] and “burned” in reactors, how many tons of uranium must be mined per year to support 18 TW via conventional fission, assuming for the sake of this problem that 5 tons of mass need to convert to energy via ?
Based on the abundance of U in the earth’s crust (Table 15.9), how many kilograms of typical crust would need to be excavated and processed per year to provide the kg of U you need for your personal energy (as in Example 15.4.2)?
In crude terms, proven uranium reserves could go another 90 years at the present rate of use. But the world gets only about a tenth of its electricity from nuclear. What does this imply about the timescale for the uranium supply if the world got all of its electricity from conventional (non-breeding) nuclear fission?
Replicate the calculation and show the work that if we have J of proven uranium reserves under conventional fission, we would exhaust our supply in less than 4 years if using this source to support the entire 18 TW global energy appetite.
Use Figure 15.18 to reconstruct the breeder route from Th to U by describing the associated nuclei and decays (and half-lives) involved.
For spent nuclear fuel a few decades old, what isotopes are responsible for most of the radioactivity, according to Figure 15.19?
Let’s say that spent fuel rods are pulled out of the holding pool at the nuclear facility ten years after they came out of the core. Based on the total radioactive power from waste products (black line on Figure 15.19), approximately how long will you have to wait until the radioactivity level is down by another factor of 1,000 from where it is at the time of extraction?
Operating approximately 450 nuclear plants over about 60 years at a total thermal level of 1 TW, we have had two major radioactive releases into the environment. If we went completely down the nuclear road and get all 18 this way, what rate of accidents might we expect, if the rate just scales with usage levels?
On balance, considering the benefits and downsides of conventional nuclear fission, where do you come down in terms of support for either terminating, continuing, or expanding our use of this technology? Should we pursue breeder reactors at a large scale? Please justify your conclusion based on the things you consider to be most important.
The sun is a fusion power plant producing W of power. How many kilograms of mass does it lose in a year trough pure energy conversion? How does this compare to the mass of a spherical asteroid 50 km in diameter whose density is 2,000 ?
Based on the fractional mass loss associated with turning four hydrogen atoms into a helium atom, what fraction of the sun’s mass would it lose over its lifetime by converting all its hydrogen into helium, under the simplifying assumption that it starts its life as 100% hydrogen?
The three fusion forms in Eq. 15.3 each have different energy outputs. Looking at Figure 15.10,[90] how would you qualitatively describe why the three reactions differ in this way?
Based on the calculation that 18 TW would require an annual cube of seawater 300 m on a side to provide enough deuterium, what is your personal share as one of 8 billion people on earth, in liters? Could you lift this yourself? One cubic meter is 1,000 L.
What are your thoughts about fusion? Are you excited, skeptical, confused, all of the above? Please offer your thoughtful assessment of the role you imagine fusion playing in our future—your best guess.
… which defines the size of the atom
… a name describing either protons or neutrons: any nuclear constituent
One might say this is what defines the carbon atom.
Even this level of detail is short of what can be found in the actual Chart of the Nuclides, which also provides quantitative values for neutron absorption, nuclear spins, excited states, additional decay paths and associated energies.
Perhaps it is fair to ignore neutrinos since they ignore us. Neutrinos interact so infrequently with matter that a neutrino could fly through light years of rocky (Earth-like) material before being expected to hit something (interact). This extreme non-interactivity earns it the title of “ghost” particle.
… and in the summary information in the blue box at the left of each row
… or long-lived enough to be found in nature
Nuclides are unstable if a lower energy (more stable) configuration is within easy reach, better balancing desire for against the cost of proton repulsion.
… in units of seconds, minutes, hours, days, or years
The burrito is also ever-so-slightly more massive if it has kinetic energy, gravitational potential energy, or any form of energy. A battery is more massive when charged, even if no atoms or electrons are added. Incidentally, charging a battery does not mean literally adding electrical charges (adding particles), but amounts to rearranging electrons among the atoms within the battery.
… ultimately given off as thermal energy to our environment
This amount of mass corresponds to that of a tiny length of hair that is shorter than it is wide.
… relating to what we call the strong nuclear force
The whole atom is around 10-10 m in scale
Find this in Table 15.5.
These numbers also appear in Table 15.5.
… thus how much energy would need to be supplied to completely unbind the entire nucleus, as in Figure 15.9
Actually, Ni wins by a hair at 8.795 MeV/nuc, but is somewhat overlooked because it is only 0.006% as abundant as Fe, whose binding energy per nucleon is essentially tied for the top at 8.790 MeV/nuc.
A peak exists because nucleons initially find advantage in binding together, but ultimately the increasing number of mutuallyrepelling protons makes the environment less appealing for larger nuclides.
This is in contrast to a fast neutron that tends to bounce rather than stick to the nucleus.
No forces prevent a neutron from approaching a nucleus. Happening to hit the tiny nucleus is the only barrier.
… very high energy photons
… usually either water or carbon in the form of graphite
U had neutrons, plus the thermal neutron addition.
… also matching the scenario in Figure 15.13 and the penultimate column of Table 15.6
This result, by the way, is the same as 172.3 MeV in Table 15.7 using the conversion that 1 MeV is J.
Binding energy reduces mass, so larger binding energy means lighter overall mass.
Each missing neutron deprives us of more than the standard MeV per nucleon, as neutrons have no penalty for repulsive electric charge. The 8 MeV per nucleon is an average over protons and neutrons.
… always this direction, so that gravity does the pulling rather then relying on some other drive force
From this, we glean that reactors average roughly 1 GW each.
Recall, for context, that solar is not among the cheaper energy resources. Like solar, nuclear power is dominated by up-front costs, rather than fuel cost.
A trace amount, 0.0055%, is in U.
Iron has ; stars tend not to produce elements beyond zinc by fusion.
This follows almost the exact same logic and process as carbon-14 radioactive dating, but using much longer half life nuclei to date Earth’s building blocks!
Uranium bombs need at least 20% U concentration, but typically aim for 85% to be considered weapons grade.
… in gaseous form
Depleted uranium is defined as containing 0.3% or less in the form of U, which is not a huge reduction from the 0.72% starting point.
… called transmutation
… e.g., for weapons
… of which 100% is the desired Th isotope
… although, radioactive waste is still problematic
Breeder reactors can “burn” the actinides, reducing some of the long-term waste threat, but will unavoidably still be left with all the radioactive fission products.
For plutonium, this process is fouled by the presence of Pu, forcing a different approach in which a sphere below critical mass is imploded to create high density.
Never stack lumps of fissile material together on a shelf, or a nasty surprise may be in store.
… much higher rate of radioactive decay
… called a “dirty bomb”
Note that cooling towers often have a plume of water vapor above them, but this is the result of evaporative cooling, and not exhaust in the usual sense.
We are unavoidably exposed to radiation in our daily lives from air, water, food, Earth, and the cosmos.
… within 10 minutes of the earthquake
… in the absence of breeder reactor implementation
… a clear, but not overwhelming, result
We might also acknowledge an intrinsic psychological appeal for complex topics that have been mastered: a sort of pride in the privileged comprehension that might transfer to warm feelings for the subject.
The calculation is that 0.0287 a.m.u. corresponds to kg, or J (26.7 MeV). We convert the Joules to kcal by dividing by 4,184, and then divide by the input mass in grams (4.03 a.m.u. times g/a.m.u.) to get 153 kcal/g. Starting with two deuterium nuclei reduces energy yield a bit to to 137 kcal/g, and for deuterium-tritium reactions it’s down to 81 million kcal/g.
For temperatures this high, it does not matter whether we specify Kelvin or Celsius, as the 273 degree difference is nothing compared to a billion degrees. The scales are therefore essentially identical here.
This is no accident: if the center were too cool, the sun would contract in the absence of radiation pressure until the center heated up from the compression and nuclear fusion ignited—just enough to hold off further contraction. It finds its own equilibrium right at the edge of fusion. In the case of the sun, all it takes is one out of every 1026 collisions to stick in order to keep the lights on.
If only the UCSD mascot were named after this triton…
… allowing beta decays to change protons to neutrons in the process
Plasma is a hot ionized gas where electrons are stripped off the nuclei. The sun qualifies as a plasma.
… in the form of radioactive release back to the plasma
Should we be proud if we succeed, or embarrassed at the lengths we had to go to?
See the Chart of the Nuclides abundance information in Figure 15.4.
… one H, one H and one oxygen
Ocean water is far easier to access than underground oil deposits, after all.
Most lithium is used in batteries; the R/P ratio in this case is 500 years.
… only 8% of current annual production
Otherwise, we’re still looking at the 500 year R/P ratio.
… the prospects for which are dubious
… thus GW thermal, given typical heat engine efficiency
… 10–20% for PV and perhaps 90% for fusion?
Transmutation of the nuclei in the material will create radioactivity.
… as it also is for solar power, which does not mean solar power is cheap
Nitrogen is the principal constituent in Earth’s atmosphere.
… and/or eating the animals that eat these plants
… a factor of 6 different
… as indicated by the orange lower-half of the corresponding box in Figure 15.4
Region descriptions can include references to the mass range (e.g., low mass or high mass), above or below the stable elements (proton-rich or neutron-rich).
ⓘ This is how much mass would have to “disappear” each year to satisfy current human demand.
0.185 out of 235 a.m.u.
Treat the two isotopes as having the same mass: the rod has 20 times more uranium than just the U part. 86: It’s not, actually, so this answer is a lower limit on the actual mass that has to be loaded in. So much for the kg answer from Problem 16.
One ton is 1,000 kg.
… given enrichment inefficiency
Tritium is not labeled, but visible just below 3 MeV on the left side.