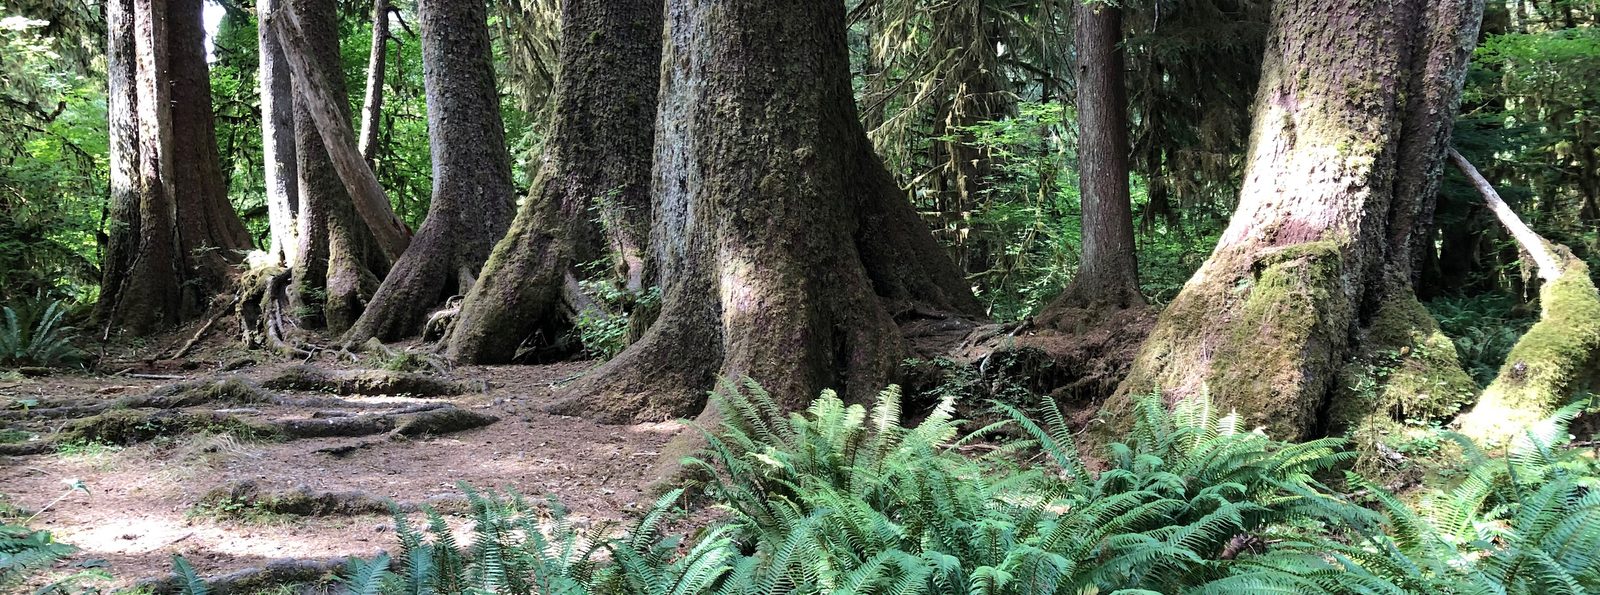
The remnant of a fallen tree—called a nurselog—provides nutrition for a row of new trees, arranged in a colonnade. Photo credit: Tom Murphy
10. Renewable Overview
We now understand that the path human civilization has traveled to this point—a path paved by fossil fuels—cannot lead very much farther before a new path must take over. One distinct possibility is a trek back toward a low-tech existence, but most people would consider such a development to be a failure. What would success look like, then? Sec. D.5 (p. 417) in the Appendices takes a look at the big picture of long-term human success, but for present purposes we will focus on the critical issue of energy: where could we get enough energy to replace the prodigious one-time gift of fossil fuels?
This chapter is very brief, only setting the stage for upcoming chapters that go into alternative energy sources in greater detail. At the end of this effort, Chapter 17 summarizes the potential of all the energy resources. For now, we describe the origins and scales of Earth’s energy inputs, and finish with a reminder of how much energy we get from these sources today.
10.1 The Players
Before launching into detailed attributes of energy sources beyond fossil fuels, it is helpful to list the cast of characters.
Hydroelectric energy (Chap. 11) traps water from a river behind a dam, forced to flow through a turbine[1] that spins a generator to make electricity.
Wind energy (Chap. 12) spins a turbine[2] that makes electricity via a generator.
Solar energy (Chap. 13) can provide direct heat or make electricity via photovoltaic (PV) panels or in a utility-scale solar thermal installation.
Biological energy (Chap. 14) can range from food to firewood, or biofuels. These are generally a source of thermal energy, via burning, able to drive heat engines.
Nuclear Fission (Chap. 15) relies on mining a finite supply of radioactive elements in the Earth’s crust whose fission (splitting) generates heat that can make steam to run a heat engine and generator to make electricity.
Nuclear Fusion (Chap. 15), if successful, would use abundant hydrogen resources from water to build helium nuclei—a process that would release heat to make steam for running a heat engine and generator to make electricity.
Geothermal energy (Chap. 16) originates in Earth’s hot interior, and can be used for heating or to make steam to run a heat engine and generator to make electricity.
Tidal Capture (Chap. 16) is very similar to hydroelectricity, but based on trapped tidal basins instead of dammed rivers.
Ocean Currents (Chap. 16) behave much like wind, and can be used similarly to produce electricity, but underwater.
Waves (Chap. 16) bring energy to shorelines that can drive specialized generators to make electricity.
One prevalent theme connects most of these entries: lots of electricity, often by way of heat engines and/or generators. Indeed, alternatives to fossil fuels tend to excel at electricity production. But as we saw in Fig. 7.2 (p. 110), electricity makes up only 38% of energy demand in the U.S., and only 17% of the energy delivered to the four end-use sectors.[3] One lesson is that current energy uses that are not electricity-based—like transportation and industrial processing[4]—will be more difficult to replace by the alternatives above.
10.2 Alternatives vs. Renewables
Before going further, we should clarify the difference between “alternative” and “renewable” resources.
The sun will continue to shine no matter how many solar panels we set out. Wind is replenished daily by the sun heating the land and driving air currents. Solar energy drives the hydrological cycle, refilling the reservoirs behind hydroelectric dams. Plants grow back to replace harvested ones—again thanks to the sun. Ocean currents and waves are also driven by the sun, via wind.
Nothing, of course, lasts forever, but the sun will continue to operate in its current mode for billions of years more, and this is long enough to count as indefinite, for our purposes. Table 10.1 classifies various sources as to whether they are alternatives or renewables, along with justifications. The items with asterisks are technically not renewable, but last long enough that we can treat them as such in a practical sense (see Box 10.1).
Table 10.1:Energy classification. Asterisks indicate non-replenished, but long-lasting sources.
| Resource | Chapter | Alternative? | Renewable? | Reason |
|---|---|---|---|---|
| Petroleum | 8 | No | No | finite supply in ground |
| Natural Gas | 8 | No | No | finite supply in ground |
| Coal | 8 | No | No | finite supply in ground |
| Hydroelectric | 11 | Yes | Yes | Sun generates rain and refills reservoirs |
| Wind | 12 | Yes | Yes | Sun generates daily by heating Earth surface |
| Solar | 13 | Yes | Yes | Sun will last billions of years |
| Biomass (wood) | 14 | Yes | Yes | Sun grows more |
| Nuclear Fission | 15 | Yes | No | finite supply of fissile material in ground |
| Nuclear Fusion | 15 | Yes | Yes* | billions of years of deuterium; not tritium/lithium |
| Geothermal | 16 | Yes | Yes* | finite, but large; rate-limited |
| Tidal Capture | 16 | Yes | Yes* | can drive Moon away eventually |
| Ocean Currents | 16 | Yes | Yes | Sun/wind-driven |
| Waves | 16 | Yes | Yes | Sun/wind-driven |
Just because a resource is renewable does not mean it is limitless.[5] We only have so much land, nutrients, and fresh water to grow biomass, for example. Cutting trees down faster than they grow back would result in depleting the resource—possibly permanently if the land is altered severely enough that trees do not grow back. Installing turbines throughout the ocean to capture ocean currents[6] would eventually create enough impediment to the flow that it could stop altogether.
10.3 Renewable Energy Budget
Notice that all of the unqualified[12] “Yes” entries in Table 10.1 originate from the sun. For that matter, fossil fuels represent captured ancient solar energy, stored for all these years. The sun sends energy toward the earth at a rate of 1,360 . Multiplying this by the projected area[13] of the earth results in 174,000 TW of solar power intercepting the earth. This number absolutely dwarfs the 18 TW societal energy budget of all humans on Earth. Figure 10.1 shows graphically what happens to this energy input.
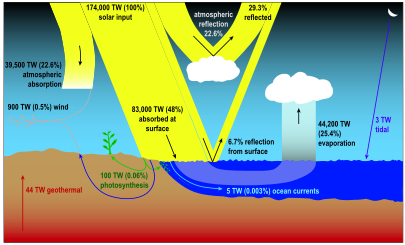
Figure 10.1:Energy inputs to the earth, ignoring the radiation piece (since that is an output channel). About 70% of incoming solar energy is absorbed by the atmosphere and land, while about 30% is immediately reflected back to space (mostly by clouds). About half of the energy absorbed at the surface goes into evaporating water, while smaller portions drive winds, photosynthesis (land and sea), and ocean currents. Additional non-solar inputs are geothermal and tidal in origin [63–65].
Clouds and ice (mostly) reflect almost 30% of incoming sunlight, leaving 123,000 TW to be absorbed by land, water, and atmosphere in various forms (see Table 10.2). Virtually all of the energy hitting the surface goes to direct thermal absorption,[16] much of which then flows into evaporation of water—the starting point of the hydrological cycle. A tiny portion of the absorbed energy gives rise to wind, some of which will drive waves. An even smaller portion contributes to photosynthesis and supports essentially all life (biology) on the planet. And finally, a tiny fragment of the absorbed energy drives ocean currents. Table 10.2 tracks where the incoming solar energy goes, in several stages, also listing non-solar geothermal and tidal contributions. For comparison, the current energy scale of human activity is approximately 18 TW, while human metabolism,[17] is about 0.8 TW.
Table 10.2:Earth’s energy input budget. Symbols , and $represent Sun, Earth, and Moon, respectively. The second group breaks out the solar input into three pieces that add to the total in the row above. The third group all comes from absorbed energy—mostly at Earth’s surface. The last group is not from radiant solar energy, so that percentages are in parentheses as they do not belong to the solar budget
| Category | Power (TW) | % solar | source | Comments |
|---|---|---|---|---|
| total solar input | 174,000 | 100 | the next 3 inputs come from here | |
| surface absorption | 83,000 | 47.9 | heats surface; evaporates HO, powers life, wind, etc. | |
| reflection to space | 51,000 | 29.3 | from clouds, ice; uncaptured energy | |
| atmos. absorption | 40,000 | 22.6 | heats atmosphere, some to wind | |
| evaporation | 44,000 | 25.4 | surf. | from surface absorption; hydrological cycle |
| wind | 900 | 0.5 | absorp. | from absorptions above, also makes waves |
| photosynthesis | 100 | 0.06 | surf. | fuels biology (life) on the planet |
| ocean currents | 5 | 0.003 | surf. | moves water around |
| geothermal | 44 | (0.025) | half original heat, half radioactive decays | |
| tides | 3 | (0.0018) | gravitational; mostly from Moon, some from Sun |
[63–65].
10.4 Renewable Snapshot
Table 7.1 (p. 111) already gave an account of the mix of energy use in the U.S., including many of the renewables. This section revisits those numbers, in slightly more detail.
Table 10.3:U.S. Renewable energy consumption in 2018. The last column compares to the 101.3 qBtu total U.S. consumption in 2018 [34]. Asterisks denote thermal equivalent conversions. While the second column of numbers would be more naturally expressed in GW, the choice of TW is deliberate to emphasize how small renewable usage is compared to the available resource.
| Source | qBtu | TW thermal equiv. | % of renewables | % of total |
|---|---|---|---|---|
| hydroelectricity | 2.77 | 0.093* | 24 | 2.7 |
| wind | 2.49 | 0.083* | 22 | 2.5 |
| wood | 2.36 | 0.079 | 21 | 2.3 |
| biofuels | 2.28 | 0.076 | 20 | 2.3 |
| solar | 0.92 | 0.031* | 8 | 0.9 |
| waste (incineration) | 0.49 | 0.016 | 4 | 0.5 |
| geothermal | 0.21 | 0.007 | 2 | 0.2 |
| total | 11.52 | 0.382 | 100 | 11.4 |
In 2018, roughly 11% of energy in the U.S. came from renewable resources. Table 10.3 lists the contributions from each, the data coming from the Annual Energy Review published by the U.S. Energy Information Administration for 2018. As introduced in Box 7.2 (p. 111), the EIA adopts the practice of assigning a thermal equivalent for each source, in qBtu, even if the source had nothing to do with a thermal process. The rationale is to put everything on the same footing as fossil fuels, for more direct quantitative comparisons. In doing so, they implicitly use the average thermal-to-delivered energy efficiency for fossil fuels of 37.5%.[25] In other words, it takes 100 units of thermal fossil energy to produce 37.5 units of useful work. If, then, a solar panel delivers 37.5 units of energy over some amount of time, it will be called 100 units of “input” (thermal equivalent), even though it only delivered 37.5 units.[26]
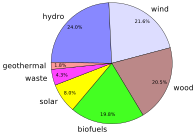
Figure 10.2:Same info as Table 10.3 in pie chart form.
Four forms dominate Table 10.3 (and Figure 10.2), each roughly equal in contribution. Lumping wood and biofuels into a generic “biomass” puts this aggregate category in the clear lead, accounting for nearly half of our renewable energy.[27] As noted, the entries in Table 10.3 are in qBtu of thermal equivalent, and these have been converted to TW, for easy comparison to Table 10.2.[28] A key take-away is how tiny the renewable energy numbers are compared to the natural flows in Earth’s energy budget.
10.5 Upshot: Our Path Forward
We are now ready to plunge into learning about renewable energy resources. The topics are arranged according to ease of understanding the associated physics, which will be new to many students. So while solar is the most potent of the resources, its chapter follows those of hydroelectricity and wind, since its scheme for generating electricity[29] is likely the least intuitive of the three. Biologically-derived energy comes next—sharing its direct sunlight origin with solar. Following a foray into nuclear energy, a number of minor contributors that are unlikely to be important are relegated to a single chapter of misfits, for completeness.
After this, we will be in a position to assess the entire landscape of alternative energy options (Chapter 17). The book will then take a turn away from physics and address how all this new information might fit into future plans at societal and personal levels.
10.6 Problems
Based on what you already know or suspect about the alternative energy sources listed in Section 10.1, which ones do you suspect[30] are pollution free (no emissions, no waste)?
Based on what you already know or suspect about the alternative energy sources listed in Section 10.1, which ones do you suspect[31] have no negative environmental impacts? Explain your reasoning.
Which of the truly renewable (“Yes” without asterisk) entries in Table 10.1 are limited (finite) in terms of the scale[32] we could achieve on Earth (explain the nature of the limit), and which are not limited (and why)?
Which four entries in Table 10.1 do not ultimately trace entirely to solar energy input to Earth?
If, for some terrible reason, the sun ceased shining and humans managed to survive for 1,000 years longer,[33] what options would be left for obtaining energy?
About 30% of the 1,360 solar power arriving at Earth is immediately bounced back without a trace. Of the part that remains, when distributed/averaged around the whole sphere,[34] what is the average energy deposition rate per square meter into the earth system?
Based on the numbers in Table 10.2, Figure 10.1, and in the text, what fraction (in percent) of all biological activity on Earth do (all) humans represent, from a metabolic energy standpoint?
Based on the numbers in Table 10.2, Figure 10.1, and in the text, what fraction (in percent) is human societal energy production (all activities; fossil fuels, etc.) compared to all biological activity on the planet?
What fraction (in percent) of the solar energy that is absorbed by Earth’s surface goes into evaporation (the hydrological cycle; refer to Table 10.2, and Figure 10.1)?
If we add up the five smallest pieces in Table 10.2, what fraction (in percent) does this set of energy flows represent in comparison to the total solar energy absorbed by the earth system?
The percentages of absorption and reflection in Figure 10.1 represent averages over weather conditions. On a clear day with the sun overhead, a solar panel has access to more light than the 48% depicted reaching the ground. If we can also capture the portion that on average is reflected by the ground and clouds,[35] what might we expect for the rate of energy reaching the ground (in if the input at the top of the atmosphere is 1,360 ?
Similar to Example 10.3.2, how much warmer would you expect a 10 cm deep puddle of water[36] to get after an hour in full sun, if the water absorbs all the energy and does not lose it to the environment?
Comparing Table 10.2 and Table 10.3, what is the most striking mismatch,[37] in terms of large potential vs. small contribution to U.S. energy consumption?
In one day, a typical residential solar installation might deliver about 10 kilowatt-hours of energy. Meanwhile, a gallon of gasoline contains about 37 kWh of thermal energy. But the two ought not be directly compared, as burning the gasoline inevitably loses a lot of energy as heat. Correcting the solar output to a thermal equivalent,[38] how many gallons per day of gasoline could it displace?
The U.S. occupies about 2% of Earth’s surface area, thus collecting only part of the 83,000 TW absorbed at the surface. Compare the amount of solar power received by the U.S. to the total renewable power in Table 10.3.[39] By what factor are we “underutilizing” the solar input, under the simplifying assumption that we could use all of it?
A turbine is basically a set of fan blades.
Wind turbines are sometimes called rotors or windmills.
While 38.3 qBtu of the 101.3 qBtu total energy input in the U.S. is dedicated to electricity production, only 13.0 qBtu emerges from the process, which is 17% of the 76 qBtu total flowing into these end-use sectors.
… which requires a lot of heat
Ultimately, only so much sunlight strikes the earth.
This would be a hugely expensive and impractical undertaking, but helps illustrate the point that renewable does not mean unlimited.
… now at 3.8 cm/year
… a conversion of gravitational potential energy
… primarily supernova explosions and neutron star mergers
Eventually it is hoped that only deuterium could be used.
… i.e., no asterisk
See Example 10.3.1.
… averaging over day, night, sun angles, and weather conditions.
That is, heating (see Example 10.3.2); note that solar panels could intercept part of this energy flow.
Recall Ex. 5.5.2 (p. 79). 100 W per person times 8 billion people is 800 GW, or 0.8 TW.
… parameters defined below
Because a Watt is a Joule per second and the table area is 1 ; the black property essentially means that it absorbs all light that hits it.
In some cases, animals ate the plants first, but the energy starts in plants.
It is not important to nail down precise numbers for this exercise.
For reference, a single large university consumes energy at about this rate.
Also coming to mind is the Big Bay Boom in San Diego, July 4, 2012, when the entire fireworks display that was meant to last 15–20 minutes all went off in a few dazzling seconds. LMAO. Best ever!
This amount of power could supply only a single campus-sized consumer on Earth.
37.5% is the 2018 number from Appendix A6 of the AER.
Alternatively, it would have taken 100 units of fossil fuel energy to match the 37.5 units of energy delivered by the solar panel.
… the other half, roughly, coming from hydroelectricity and wind
⚠ The items with asterisks in Table 10.3 will not match production numbers in later chapters for non-thermal resources that are not expressed in thermal-equivalent terms.
Hydroelectricity and wind share much in common with conventional power generation schemes, in that they use turbines and generators.
Don’t worry about correctness, as this is an opportunity to think and gauge current understanding.
Don’t worry about correctness, as this is an opportunity to think and gauge current understanding.
… not how long it can last; how much power is available
It’s nearly impossible to imagine that survival is at all realistic in this dire situation.
⚠ account for projected vs. total surface area
Recall, it’s a clear day; no clouds.
ⓘ Water has a density of 1,000 kg per cubic meter and a specific heat capacity of 4,184 . Make up whatever area you want; the answer should be the same for any pick.
In other words, for those sources that can be matched within the tables, which stands out as the most underutilized relative to its input numbers?
ⓘ Use the 37.5% factor discussed in
… since it’s almost all solar in ultimate origin