Shorter wavelengths can improve diffraction-limited resolution, but ultraviolet and X-ray microscopy also face absorption, contrast, specimen-damage, and optics-design constraints. This chapter introduces methods that increase contrast, improve optical sectioning, or access spatial detail beyond a conventional far-field microscope. Research continues on other routes to subwavelength imaging, including metamaterial proposals inspired by Pendry’s idealized negative-refraction lens.[1]
1Phase Contrast Microscope¶
Suppose a transparent specimen changes the phase of a transmitted field without changing its amplitude: . An ideal, in-focus bright-field image has intensity , so it has no contrast for this pure phase object.
For a weak phase object, choose the surrounding medium as the phase reference and take the specimen-induced phase to be small. Then . The first term is the undeviated background field; the second is the light scattered by phase variations. A phase plate near the objective’s Fourier plane shifts the undeviated component by relative to the scattered component. In this idealized model the image field becomes
Its intensity is therefore
to first order in . The sign of the contrast reverses if the phase plate applies the opposite relative shift. Real phase-contrast microscopes use an annular illumination source and a matching phase ring; attenuation of the background and imperfect separation of diffracted light also affect the image.[2] The weak-phase approximation works best for thin, weakly scattering samples.
2Confocal Microscope¶
A confocal microscope illuminates one small region of a specimen at a time and places a pinhole in a conjugate detection plane. By scanning the focus laterally, it constructs an image; a stack of images at different depths can be used for a three-dimensional reconstruction. Figure 1 shows a reflected-light arrangement based on the geometry of Minsky’s early microscope.
Light from the focused spot returns through the objective and is directed toward the detector. Light from the focal plane is concentrated at the detection pinhole, while out-of-focus light is spread over a larger area and is mostly blocked. This gives optical sectioning and improved axial discrimination. The effective response combines the focused illumination profile with the detection profile; a sufficiently small pinhole can also narrow the lateral point-spread function. Resolution and signal depend on wavelength, numerical aperture, pinhole size, and specimen properties, so no single nanometre figure applies to every confocal microscope. Closing the pinhole rejects more out-of-focus light but also reduces detected signal. Scanning requires the specimen to remain sufficiently stable during acquisition.
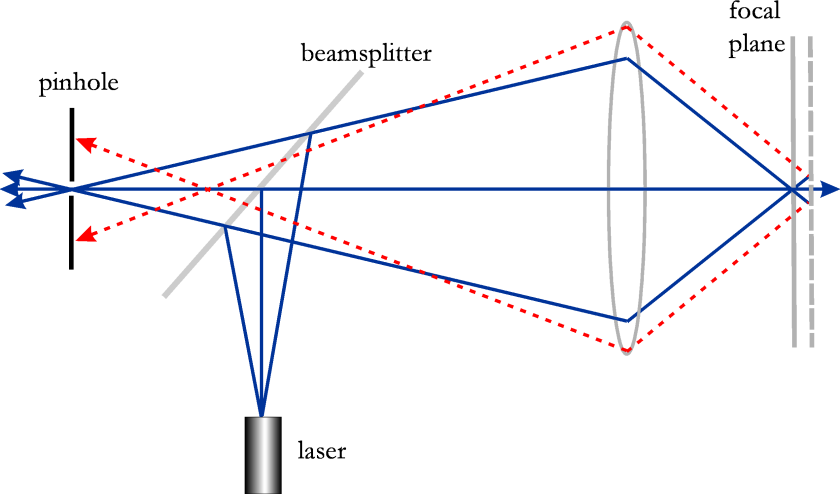
Figure 1:Reflected-light confocal microscope: focused illumination and a detection pinhole select light from the focal plane.
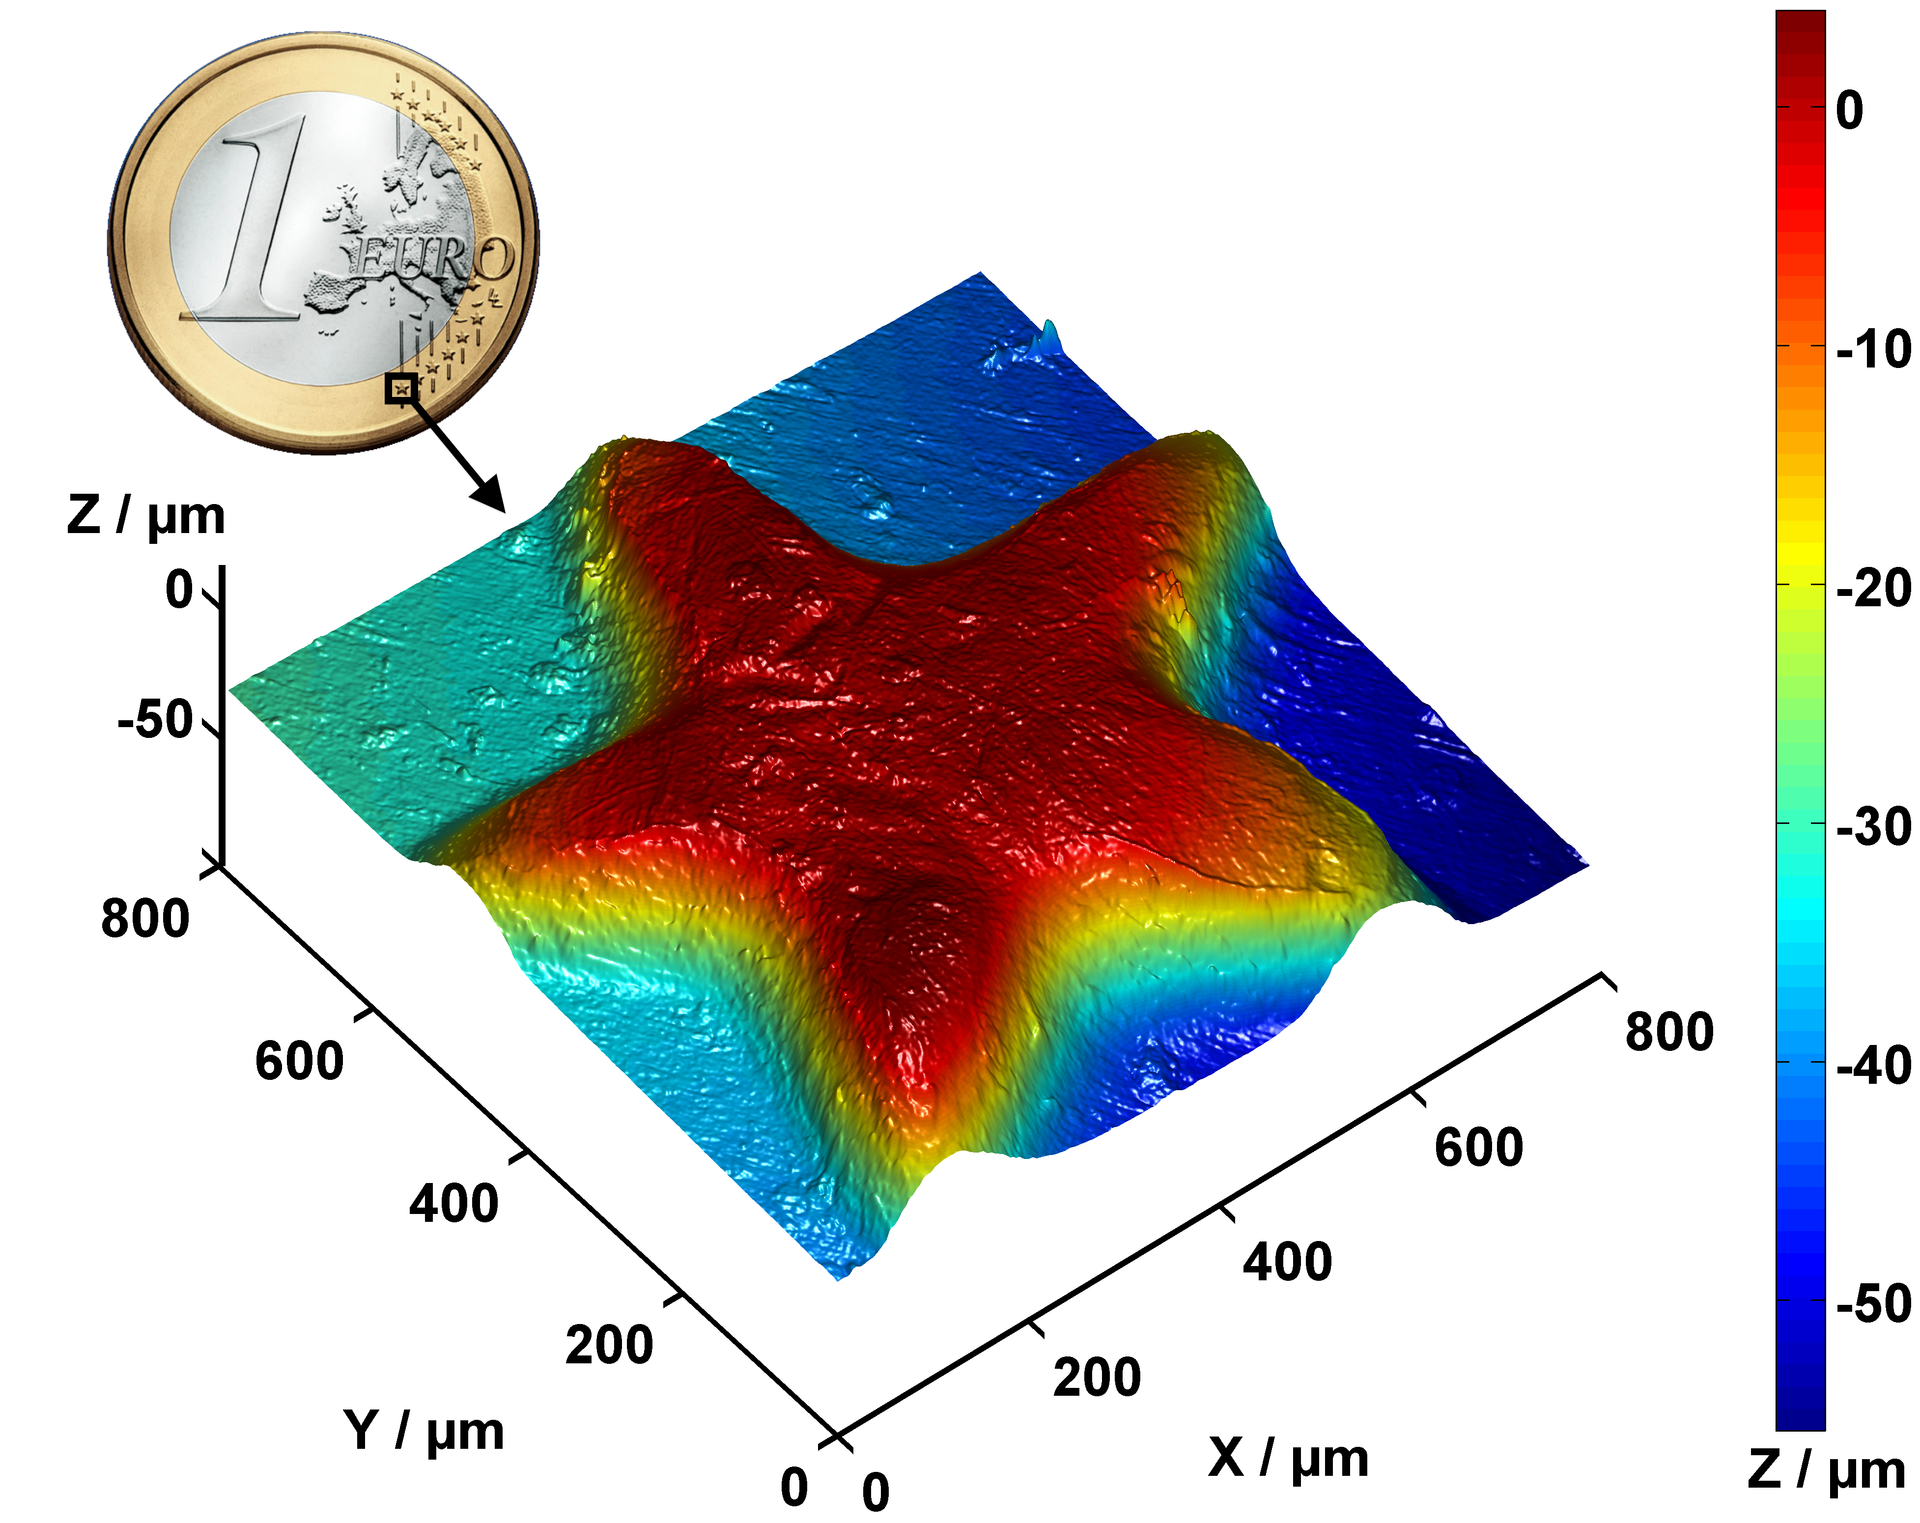
Figure 2:Color-coded confocal surface-height map of a star on a one-euro coin, with lateral axes in micrometres and a height scale at right. Image source: Wikimedia Commons.
3Fluorescence Microscope¶
Fluorescent labels, such as green fluorescent protein (GFP) or fluorescent dyes, can mark structures of interest. Illumination excites the labels, which emit light at wavelengths that are usually longer than the excitation wavelength. A dichroic mirror directs excitation light toward the sample while transmitting or reflecting the emitted light along a separate detection path; an emission filter further rejects excitation light. A pinhole is used when fluorescence imaging is also confocal, but is not required for ordinary wide-field fluorescence microscopy. Different labels can produce the multicolor image in Figure 3.
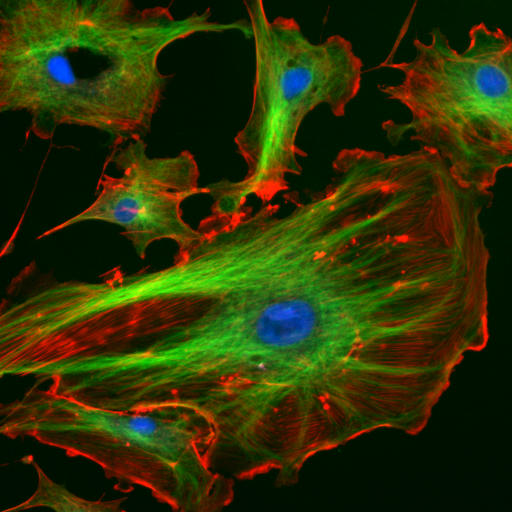
Figure 3:Fluorescence image of endothelial cells: nuclei are blue, microtubules green, and actin filaments red. Image source: Wikimedia Commons.
4Scanning Near-Field Optical Microscope¶
As discussed in Scalar Diffraction Optics, high spatial-frequency components of an optical field can be evanescent and decay before reaching a distant objective. An immersion objective increases the collection numerical aperture and improves conventional far-field resolution, but it does not by itself recover arbitrarily fine evanescent detail.
A scanning near-field optical microscope (SNOM, also called NSOM) places a probe within a small fraction of a wavelength of the specimen. In collection mode, the sample is illuminated and a subwavelength tip collects local optical signals, as shown in Figure 4. In excitation mode, light exits a subwavelength tip close to the sample and a conventional detector collects light scattered or emitted by the locally illuminated region. Both modes scan the tip relative to the sample to build an image. Their resolution depends on tip size, tip-sample separation, throughput, and the sample response; an aperture diameter alone does not fix it.
Figure 5 shows an atomic-force-microscopy topography image of a patterned structure. Such a height map helps identify features, but by itself is not an optical SNOM image. In near-field measurements, the probe can disturb the field it samples, so optical contrast and surface topography must be interpreted carefully.
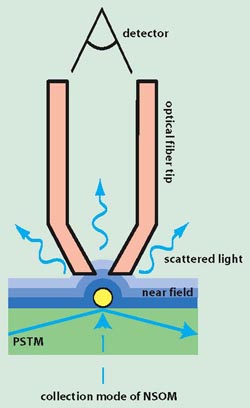
Figure 4:Collection-mode SNOM schematic: a subwavelength fiber tip gathers light from the illuminated sample and carries it to a detector.
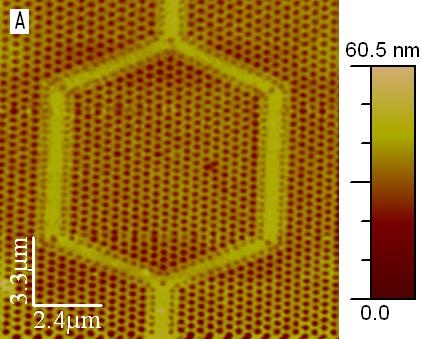
Figure 5:Atomic-force-microscopy topography of a patterned photonic structure, with a 2.4 μm horizontal scale bar and a 0–60.5 nm height scale. This image does not display a companion optical SNOM panel.
5Chapter Summary¶
Diffraction limit constrains conventional optical microscopy to a resolution of approximately .
Phase contrast microscopy converts phase differences (in transparent samples) into intensity variations using a phase plate.
Confocal microscopy uses point illumination and a pinhole detector to achieve optical sectioning and improved axial resolution.
Fluorescence microscopy uses fluorescent labels (e.g., GFP) that emit at longer wavelengths than excitation; dichroic mirrors separate excitation and emission.
Confocal fluorescence microscopy combines fluorescence with confocal sectioning for 3D imaging of biological samples.
Scanning Near-Field Optical Microscopy (SNOM) uses a nearby probe to sample local optical fields and resolve some features below the far-field diffraction scale.
Collection mode SNOM: A sub-wavelength tip collects the near field while the sample is illuminated from far field.
Excitation mode SNOM: A sub-wavelength tip illuminates the sample, and far-field detection captures super-resolved information.
Immersion microscopy can increase numerical aperture by using a high-index fluid between specimen and objective.
All near-field techniques require the probe to be very close to the sample, which may perturb the measurement.
See also Hecht, Optics, §13.2.4, “Phase Contrast.”
- Pendry, J. B. (2000). Negative Refraction Makes a Perfect Lens. Physical Review Letters, 85(18), 3966–3969. 10.1103/physrevlett.85.3966