NGC 253 photo credit: Dylan O’Donnell.
1. Exponential Growth
Humans have amazing strengths, but also significant weaknesses. Chief among them, perhaps, is our collective difficulty in grasping the mathematical consequences of exponential growth.[1] This is an ironic state, given that our economic and political goals are often geared explicitly to support continued growth. The degree to which an expectation and desire for continued growth is woven into our society makes it important to examine the phenomenon carefully, so that we might avoid building upon a shaky foundation. In this chapter, we explore the general nature of exponential growth, in order to understand the impossibility of its long-term continuance by way of exposing various absurd consequences that uninterrupted growth prescribes. The upshot[2] is that our societal framework eventually must face a mandatory departure from the current model—a piece of knowledge we should all lodge into the backs of our minds. Subsequent chapters will address applications to economic and population growth—including more realistic logistic growth curves, then pivot toward nailing down limits imposed by our finite planet.
1.1 Bacteria in a Jar
One hallmark of exponential growth is that the time it takes to double in size, or the doubling time, is constant. An important and convenient concept we will repeatedly use in this chapter is the rule of 70:
We will see how the rule of 70 arises mathematically later in this chapter. But first, it is more important to understand the consequences. To make the math simple, let’s say that a town’s size doubles every 10 years (which by the rule of 70 corresponds to a 7% growth rate, incidentally). Starting in the year 1900 at 100 residents, we expect town population to be 200 in 1910, 400 in 1920, 800 in 1930, eventually climbing to over 100,000 by the year 2000 (see Table 1.1). Unabated 7% growth would result in the town reaching the current world population just 260 years after the experiment began.
Table 1.1:Example 7% growth progression.
| Year | Population |
|---|---|
| 1900 | 100 |
| 1910 | 200 |
| 1920 | 400 |
| 1930 | 800 |
| 1940 | 1,600 |
| ⋮ | ⋮ |
| 2000 | 102,400 |
But let’s explore an example that often reveals our faulty intuition around exponential growth. Here, we imagine a jar rich in resources, seeded with just the right number of bacteria so that if each bacterium splits every 10 minutes, the jar will become full of bacteria in exactly 24 hours. The experiment starts right at midnight. The question is: at what time will the jar be half full?
Think about this on your own for a minute. Normal intuition might suggest a half-full jar at noon—halfway along the experiment. But what happens if we work backwards? The jar is full at midnight, and doubles every ten minutes. So what time is it half full?
The answer is one doubling-time before midnight, or 11:50 PM. Figure 1.1 illustrates the story. At 11 PM, the jar is at one-64th capacity, or 1.7% full. So, for the first 23 of 24 hours, the jar looks basically empty. All the action happens at the end, in dramatic fashion.

Figure 1.1:The last 90 minutes in the sequence of bacteria (green) growing in a jar, doubling every 10 minutes. For the first 22.5 hours, hardly anything would be visible. Note that the upward rise of green “bars” makes an exponential curve.
Now let’s imagine another illustrative scenario in connection with our jar of bacteria. The time is 11:30 PM: one-half hour before the end. The jar is one-eighth full. A thoughtful member of the culture projects the future and decides that more uninhabited resource-laden jars must be discovered in short order if the culture is to continue its trajectory. Imagine for a second the disbelief expressed by probably the vast majority of other inhabitants: the jar is far from full, and has served for 141 generations—a seeming eternity. Nonetheless, this explorer returns reporting three other equal-sized food-filled jars within easy reach. A hero’s welcome! How much longer will the culture be able to continue growing? What’s your answer? The population doubles every ten minutes. If the original jar is filled at 12:00, the population doubles to fill the second jar by 12:10. Another doubling fills all four by 12:20. The celebration is short-lived.
Now we draw the inevitable parallels. A planet that has served us for countless generations, and has seemed effectively infinite—imponderably large—makes it difficult for us to conceive of hitting limits. Are we half-full now? One-fourth? One-eighth? All three options are scary, to different degrees. At a 2% rate of growth (in resource use), the doubling time is 35 years, and we only have about a century, even if at 1/8 full right now.[3]
In relation to the bacteria parable, we’ve already done a fair bit of exploring. We have no more jars. One planet rhymes with jars, but it is hostile to human life, has no food, and is not within easy reach. We have no meaningful outlet.[4] And even if we ignore the practical hardships, how much time would a second planet buy us anyway for uninterrupted growth? Another 35 years?
1.1.1 Exponential Math
The essential feature of exponential growth is that the scale goes as the power of some base (just some number) raised to the time interval. In the doubling sequence, we start at the original scale, then go to , then , then , etc. At each time interval, we multiply by 2 (the base). After 5 such intervals, for instance, we have 2 , or . More generally, after doubling times, we have increased by a factor of , where 2 is the base, and is the number of doubling times. We might formalize this as
where represents the multiplicative scale, is the elapsed time, and is the symbol we choose to represent the doubling time—so that is just “counting” the number of doubling times.
Table 1.2:Interest example (2% rate).
| year | dollars | |
|---|---|---|
| 0 | 1.00 | $100.00 |
| 1 | 1.02 | $102.00 |
| 2 | 1.0404 | $104.04 |
| 3 | 1.0612 | $106.12 |
| ⋮ | ⋮ | ⋮ |
| 10 | 1.2190 | $121.90 |
| ⋮ | ⋮ | ⋮ |
| 35 | 1.9999 | $199.99 |
The pattern—whether doubling, or applying interest as in Box 1.2—is that we multiply a chain of the same number, the base, over and over. This is the same as raising the base to some power—the power equaling how many times the base appears in the chain to get our overall factor. Therefore, if we designate the base as and the number of times it appears as , we have
Now we’re going to play a math trick that will help us compute various useful attributes of growth. The exponential and natural logarithm are inverse functions, each undoing the other. So and . We can use this trick to express the number 2 as , or any base number . For the special case of (doubling), we then have:
where we started with Eq. 1.1, re-expressed the number 2, and then applied the rule that raising a power to another power is the same as multiplying the powers to form a single one.[6] By employing such tricks, we could cast any base to a power, like as some exponential function , and thus can transform any “power” relationship into an exponential using base . Casting Eq. 1.2 in this form:
If we want to go backwards, and compute the time to reach a certain factor, we can take the natural logarithm of both sides to learn that
so that the number of applications of base, , needed to achieve multiplicative factor is found by solving the equation above for , in which case we get: .
The rule of 70 can be recovered[7] by setting the multiplicative factor, , to 2. Comparing to interest accumulation described by , where is the annual interest (0.02 for 2%, e.g.) and is the number of years, Eq. 1.4 can be re-expressed by substituting and as the number of years, then equating the result to the doubling time representation in Eq. 1.3 to form
From this expression, we can gather that by equating the exponents, and then see that the doubling time, , can be solved as
For small values of (much smaller than 1), the natural log of 1 is approximately . In other words, when . This is part of the reason why we chose as our base, as it is mathematically “natural.” Since ln 2 , the doubling time, , is approximately 70 divided by the annual growth rate, , in percent. So the reason it’s a rule of 70 for doubling (and not a rule of 60 or 80) is basically because the natural log of 2 (representing doubling) is roughly 0.70.
1.2 Exponential Energy Extrapolation
Having established some basic principles of exponential growth, it’s time for a first look at how we can use the math to argue about limits to our expectations. We’ll concentrate on energy use. The United States Energy Information Administration (EIA) provides information on energy use from 1949 to the present. An appendix (E1: [3]) presents an approximate account of energy use from 1635–1945. Figure 1.2 displays the more recent portion of this history.
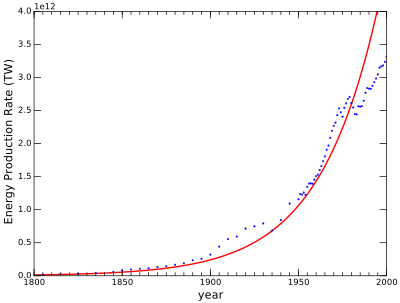
Figure 1.2:U.S. energy over 200 years, showing a dramatic rise due almost entirely to fossil fuels. The red curve is an exponential fit tuned to cover the broader period shown in Figure 1.3.
Note that the energy rate at the left edge of Figure 1.2 becomes almost invisibly small. Presenting the data on a logarithmic plot, as in Figure 1.3, we can better see the entire trajectory. On such a plot, exponentials become straight lines. The trend is remarkably consistent with an exponential (red line) for most of the history, at a rate just shy of 3% per year. Note that this total effect includes population growth, but population has not grown as fast as energy, so that per-capita energy has also risen. This makes sense: our lives today are vastly more energetically rich than lives of yesteryear, on a per-person basis.
Having established that energy growth over the past several centuries is well-described by an exponential, we can explore the implications of continuing this trend forward. Starting at a present-day global energy production rate of Watts (18 TW), we adopt a convenient growth rate of 2.3% per year for this exercise. We pick this for two reasons: 1) it is more modest than the historical trend, so will not over-exaggerate the
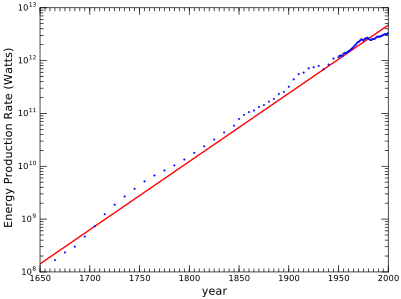
Figure 1.3:Energy trajectory in the U.S. over a long period. The red line is an exponential at a 2.9% growth rate, which appears linear on a logarithmic plot.
result; 2) this rate produces the mathematical convenience of a factor of 10 increase every century.[8]
What follows is a flight of fancy that quickly becomes absurd, but we will chase it to staggering levels of absurdity just because it is fun, instructive, and mind-blowing. Bear in mind that what follows should not be taken as predictions[9] of our future: rather, we can use the absurdity to predict how our future will not look!
The sun deposits energy at Earth’s surface at a rate of about 1,000 (1,000 Watts per square meter; we’ll reach a better understanding for these units in Chapter 5). Ignoring clouds, the projected area intercepting the sun’s rays is just , where is the radius of the earth, around 6,400 km. Roughly a quarter of the earth’s surface is land, and adding it all up we get about 30 W hitting land. If we put solar panels on every square meter of land converting sunlight to electrical energy at 20% efficiency,[10] we keep 6 W. This is a little over 300 times the current global energy usage rate of 18 TW. What an encouraging number! Lots of margin. How long before our growth would get us here? After one century, we’re 10 times higher, and 100 times higher after two centuries. It would take about 2.5 centuries (250 years) to hit this limit. Then no more energy growth.
But wait, why not also float panels on all of the ocean, and also magically improve performance to 100%? Doing this, we can capture a whopping 130 W, over 7,000 times our current rate. Now we’re talking about maxing out in just under 400 years. Each factor of ten is a century, so a factor of 10,000 would be four factors of ten , taking four centuries.
So within 400 years, we would be at the point of using every scrap of solar energy hitting the planet at 100% efficiency. But our planet is a tiny speck in space. Why not capture all the light put out by the sun, in a sphere surrounding the sun (called a Dyson sphere; see Box 1.3)? Now we’re talking some real power! The sun puts out 4 W. If it were a light bulb, this would be its label (putting the 100 W standard incandescent bulb to shame). So the number is enormous. But the math is actually pretty easy to grasp.[11] Every century gets another factor of ten. To go from where we are now (18 W) to the solar regime is about 14 orders-of-magnitude. So in 1,400 years,[12] we would be at 18 W, which is about 4.5 times the solar output. Therefore we would use the entire sun’s output in a time shorter than the 2,000-year run of our current calendar.
Bypassing boring realism, we recognize that our sun is not the only star in the Milky Way galaxy. In fact, we estimate our galaxy to contain roughly 100 billion stars! This seems infinite. A billion seconds is just over 30 years, so no one could count to 100 billion in a lifetime. But let’s see: 100 billion is 1011. Immediately, we see that we buy another 11 centuries at our 2.3% rate. So it takes 1,100 years to go from consuming our entire sun to all the stars in our galaxy! That’s 2,500 years from now, adding the two timescales, and still a civilization-relevant time period. Leave aside the pesky fact that the scale of our galaxy is 100,000 light years, so that we can’t possibly get to all the stars within a 2,500 year timeframe. So even as a mathematical exercise, physics places yet another limit on how long we could conceivably expect to maintain our current energy growth trajectory.
Table 1.3:Energy limit timescales.
| Utilizing | years until |
|---|---|
| Solar, land, 20% | 250 |
| Solar, earth, 100% | 390 |
| Entire Sun | 1,400 |
| Entire Galaxy | 2,500 |
| Light in Universe | 3,600 |
| Mass in Universe | 5,000 |
The unhinged game can continue, pretending we could capture all the light put out by all the stars in all the galaxies in the visible universe. Because the visible universe contains about 100 billion galaxies, we buy another 1,100 years. We can go even further, imagining converting all matter (stars, gas, dust) into pure energy , not limiting ourselves to only the light output from stars as we have so far. Even playing these unhinged games, we would exhaust all the matter in the visible universe within 5,000 years at a 2.3% rate. The exponential is a cruel beast. Table 1.3 summarizes the results.
The point is not to take seriously the timescales for conquering the sun or the galaxy. But the very absurdity of the exercise serves to emphasize the impossibility of our continuing exponential growth in energy. All kinds of reasons will preclude continued energy growth, including the fact that human population cannot continue indefinite growth on this planet. We will address space colonization fantasies in Chapter 4.
1.3 Thermodynamic Consequences
Physics places another relevant constraint on growth rate, and that concerns waste heat. Essentially all of our energy expenditures end up as heat. Obviously many of our activities directly involve the production of heat: ovens, stoves, toasters, heaters, clothes dryers, etc. But even cooling devices are net heat generators. Anything that uses power from an electrical outlet ends up creating net heat in the environment, with very few exceptions. A car moving down the road gets you from place A to place B, but has stirred the air,[13] heated the engine and surrounding air, and deposited heat into the brake pads and rotors, tires and road. Our metabolic energy mostly goes to maintaining body temperature. But even our own physical activity tends to end up as heat in the environment. The only exceptions would be beaming energy out of the earth environment (e.g., light or radio) or putting energy into storage (eventually to be converted to heat). But such exceptions do not amount to much, quantitatively.
What happens to all of this waste heat? If it all stayed on Earth, the temperature would climb and climb. But the heat does have an escape path: infrared radiation[14] to space. The earth is in an approximate thermodynamic equilibrium: solar energy is deposited, and infrared radiation balances the input to result in steady net energy. As we will see in Chapter 5, the rate at which energy flows is called power, so that we can describe energy flows into and out of the earth system in terms of power. Physics has a well-defined and simple rule for how much power a body radiates, called the Stefan–Boltzmann law:[15]
is the power radiated, is the surface area, is the temperature of the radiating object in Kelvin[16] (very important!), is the temperature of the environment (also Kelvin), and is the Stefan–Boltzmann constant: [17] Note that the law operates on the difference of the fourth powers of two temperatures.
Because space is so cold (tens of Kelvin, effectively, unless exposed to the sun), the fourth power of such a small number pales so much in comparison to the fourth power of a number like 300 that we can safely ignore it for radiation to space:
where we now just have a single temperature: that of the warm body in space.
Earth reaches an equilibrium so that power–in equals power–out.[18] If more power is dumped onto the planet, then the temperature rises until climbs to match. The relation in Eq. 1.9 is fundamentally important to Earth’s temperature balance, and applies pretty universally, as highlighted in Box 1.4.
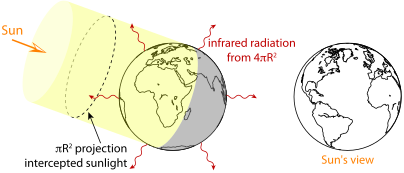
Figure 1.4:Earth—shown here in northern hemisphere summer—intercepts sunlight across the projected area of the Earth’s disk , while radiating from the entire surface area, which is four times larger .
To evaluate the expected temperature of the earth, we know that the sun delivers 1,360 to the top of the earth’s atmosphere [4] (a bit less reaches the ground). We also know that about 29.3% of this is reflected by clouds, snow, and to a lesser extent water and terrain. So the earth system absorbs about 960 . It absorbs this energy onto the area facing the sun: a projected disk of area . But the total surface area of the earth is four times this, all of it participating in the radiation to space (Figure 1.4). Equating the input and output for equilibrium conditions:
which we can rearrange to isolate temperature, satisfying
Solving for yields K, or (about F). This is cold—too cold. We observe the average temperature of Earth to be about 288 K, or F). The difference of is due to greenhouse gases—mostly HO—impacting the thermal balance by preventing most radiation from escaping directly to space. We’ll cover this more extensively in Chapter 9.
Armed with Eq. 1.11, we can now estimate the impact of waste heat on Earth’s equilibrium temperature. Using the solar input as a baseline, we can add increasing input using the exponential scheme from the previous section: starting today at 18 TW and increasing at 2.3% per year (a factor of 10 each century). It is useful to express the human input in the same terms as the solar input so that we can just add to the numerator in Eq. 1.11. In this context, our current 18 TW into the projected area adds 0.14 to the solar input (a trivial amount, today), but then increases by a factor of ten each century. Taking this in one-century chunks, the resulting temperatures—adding in the 33 K from greenhouse gases—follow the evolution shown in Table 1.4. At first, the effect is unimportant, but in 300 years far outstrips global warming, and reaches boiling temperature in a little over 400 years! If we kept going (not possible), Earth’s temperature would exceed the surface temperature of the sun inside of 1,000 years!
Table 1.4:At a constant energy growth rate of 2.3% per year, the temperature climb from waste heat (not CO emissions) is slow at first, but becomes preposterous within a few-hundred years. Water boils in just over 400 years, and by 900 years Earth is hotter than the sun! The scenario of continued growth is obviously absurd.
| Years | Power Density | (K) | (C) |
|---|---|---|---|
| 100 | 1.4 | 288.1 | 0.1 |
| 200 | 14 | 288.9 | |
| 300 | 140 | 296.9 | |
| 400 | 1,400 | 344 | 56 |
| 417 | 2,070 | 373 | 100 |
| 1,000 | 8,600 | 8,300 |
Connecting some ideas, we found in the previous section that we would be consuming the sun’s entire output in 1,400 years at the 2.3% growth rate. It stands to reason that if we used a sun’s worth of energy confined to the surface of the earth, the (smaller) surface would necessarily be hotter than the sun (in 1,400 years), just like a light bulb filament is hotter than human skin despite putting out the same power—owing to the difference in area.[19]
One key aspect of this thermal radiation scenario is that it does not depend on the form of power source. It could in principle be fossil fuels, nuclear fission, nuclear fusion, or some form of energy we have not yet realized and may not even have named! Whatever it is, it will have to obey thermodynamics. Thus, thermodynamics puts a time limit on energy growth on this planet.
1.4 Upshot: Physics Limits Physical Growth
We saw in this chapter that unabated growth leads to absurd results. First, we calibrated our intuition in the context of bacteria in jars. The key point is that the jar is half full one doubling time before it is full. While this seems obvious, it delays the drama to the very end, acting fast to impose hard limits and catch the inhabitants by surprise. The conditions that persisted for many generations—thus taken for granted—suddenly change completely.
Next, we found that continuing a modest growth rate in energy becomes hopelessly absurd in a matter of centuries. Then we saw another side to this coin, in the context of thermal consequences on the surface of the earth if energy growth continues.
In the end, physics puts a timeline on expectations with respect to growth in energy on Earth. Maybe the year scale is not alarming enough. But it imposes a hard barrier against preserving our historical growth rate. In reality, other practicalities are likely to assert themselves before these hard limits are reached. We can therefore expect our growth phase to end well within a few hundred years. Given that the growth phase has lasted for far longer than that, we can say that we are closer to the end of the saga than to the beginning, yet the world is not collectively preparing for such a new reality. This seems unwise, and we will evaluate related concerns in subsequent chapters.
Many factors will intercede to limit growth in both population and resource use: resource scarcity, pollution, aquifer depletion and water availability, climate change, warfare, fisheries collapse, a limited amount of arable land (declining due to desertification), deforestation, disease, to name a few. The point is only reinforced. By some means or another, we should view the present period of physical growth as a temporary phase: a brief episode in the longer human saga.
1.5 Problems
Hint: for problems that require solving temperature when it appears as , you’ll need to take the fourth root, which is the same as raising to the power. So use the button (or equivalent) and raise to the 0.25 power. You can check this technique by comparing the square root of a number to the result of raising that number to the 0.5 power. Another technique for the fourth root is to take the square root twice in a row.
Verify the claim in the text that the town of 100 residents in 1900 reaches approximately 100,000 in the year 2000 if the doubling time is 10 years.
Fill out Table 1.1 for the missing decades between 1940 and 2000.
Our example town from the text (page 4) starting at 100 people in the year 1900 and doubling every 10 years was said to take about 260 years (26 doubling times) to reach world population. Verify that the population indeed would approach 7 billion in 260 years (when the year would be 2160), by any means you wish.[20]
Use Eq. 1.5 with to figure out exactly how many years—via a computation of doubling times, which may not be an integer—our example town from the text (page 4) would take to reach 7 billion people.
If our example town from page 4, doubling every 10 years, reaches a population of 7 billion in 260 years, how many years before it reaches 14 billion?
In a classic story, a king is asked to offer a payment as follows: place one grain of rice on one square of a chess board (64 squares), then two on the next square, four on the next, 8 on the next, and double the previous on each subsequent square. The king agrees, not comprehending exponential growth. But the final number (adding all the grains) is one less than 264. How many grains is this?
In the bacteria example of Section 1.1, how many “doubling times” are present in the 24 hour experiment (how many times did the population double)?
A one-liter jar would hold about 1016 bacteria. Based on the number of doubling times in our 24-hour experiment, show by calculation that our setup was woefully unrealistic: that even if we started with a single bacterium, we would have far more than 1016 bacteria after 24 hours if doubling every 10 minutes.
If a one-liter jar holds 1016 bacteria, how many bacteria would we start in the jar so that the jar reaches full capacity after 24 hours if we increase the doubling time to a more modest/realistic 30 minutes?
A more dramatic, if entirely unrealistic, version of the bacteria–jar story is having the population double every minute. Again, we start the jar with the right amount of bacteria so that the jar will be full 24 hours later, at midnight. At what time is the jar half full now?
In the more dramatic bacteria–jar scenario in which doubling happens every minute and reaches single-jar capacity at midnight, at what time will the colony have to cease expansion if an explorer finds three more equivalent jars in which they are allowed to expand without interruption/delay?
What is the doubling time associated with 3.5% annual growth?
Using Eq. 1.5 and showing work, what annual growth rate, in percent, leads to the mathematically convenient factor-of-ten growth every century?
Use Eq. 1.5 with to figure out how long it takes to increase our energy by a factor of 10 if the growth rate is closer to the historical value of 2.9% . Using 2.3% as we did in the examples (starting on page 8) puts this at 100 years.[21]
Extrapolating a constant growth rate in energy is motivated by historical performance. During this period, population was also growing, albeit not as fast. If population were to double every 50 years,[22] how many people would Earth host when we hit the energy/thermodynamic limits in roughly 300 years?
In extrapolating a 2.3% growth rate in energy, we came to the absurd conclusion that we consume all the light from all the stars in the Milky Way galaxy within 2,500 years. How much longer would it take to energetically conquer 100 more “nearby” galaxies, assuming they are identical to our own?
In the spirit of outlandish extrapolations, if we carry forward a 2.3% growth rate per century), how long would it take to go from our current 18 TW (18 W) consumption to annihilating an entire earth-mass planet every year, converting its mass into pure energy using ? Things to know: Earth’s mass is 6 kg; m/s; the result is in Joules, and one Watt is one Joule per second.
Taking cues from the discussion of waste heat channels on page 11, describe some of the ways that all your energy output turns to heat when you go on a bicycle ride.
Your skin temperature is about 308 K, and the walls in a typical room are about 295 K. If you have about 1 of outward-facing surface area, how much power do you radiate as infrared radiation, in Watts? Compare this to the typical metabolic rate of 100 W.
The moon absorbs 90% of the solar energy incident on it.[23] How hot would you expect the surface to get under full sun? You don’t need the factor of four here[24] because the moon rotates very slowly under the sun and we’re considering a patch experiencing overhead sunlight (rather than averaging over the sphere). Compare the result to boiling water temperature.
Venus is, ironically, colder than Earth as an infrared radiator. This is because Venus is covered in bright clouds, absorbing only 25% of the incident solar flux. Sunlight is more intense there due to it’s being closer to the sun: it’s almost double, at 2,620 . Adapting Eq. 1.11, calculate the equilibrium temperature of Venus in the infrared and compare it to the Earth value of 255 K.
Adapt Eq. 1.11 to Mars to find its equilibrium temperature. The solar flux averages 590 there, and it absorbs 75% of incident sunlight. Express the answer in both Kelvin and Celsius, and put in context.
If a human body having an outward surface area of 1 continued to put out 100 W of metabolic power in the form of infrared radiation in the cold of space (naked; no sun), what would the equilibrium temperature be? Would this be comfortable (put in context)?
Verify the total solar power output of 4 W based on its surface temperature of 5,800 K and radius of 7 m, using Eq. 1.9.
Verify that Earth would reach a temperature far in excess of boiling point of water[25] after 500 years if today’s power output (18 TW) increased by a factor of 10 each century.
… a nod to Al Bartlett, who worked to raise awareness about exponential growth
The word “upshot” means final result or bottom-line. Each chapter has an Upshot at the end.
If we’re at 1/8 right now and double every 35 years, we will be at 1/4 in 35 years, 1/2 in 70 years, and full in 105 years.
Unlike words/language, the symbols chosen for equations are just labels and carry no intrinsic meaning—so electing to use , etc. reflect arbitrary choices and can be substituted at will, if done consistently. The content is in the structure of the equation/sentence.
As an example, think of as 5 , which is just 12 fives multiplied, or
⚠ Do not interpret this section as predictions of how our future will go.
20% is on the higher end for typical panels.
Math becomes easier if you blur your vision a bit and do not demand lots of precision. In this case, we essentially ignore everything but the exponent, recognizing that each century will increment it by 1, at our chosen 2.3% rate.
In this case, the “real” answer would be 1,335 years, but why fret over the details for little gain or qualitative difference in the outcome?
Stirred-up air eventually grinds to a halt due to viscosity/friction, becoming heat.
… a form of electromagnetic radiation
… leaving out something called emissivity, not relevant for our purposes
Conversions to Kelvin from Celsius (or Fahrenheit) go like: ; F
It’s actually an easy constant to remember: 5-6-7-8 (but must remember the minus sign on the exponent).
E.g., brute force doubling 26 times or using math to get straight at the answer.
Hint: a good way to check your math. Note that if we were to use 2.9% instead of 2.3%, all of the time estimates in Section 1.2 are reduced by the ratio of this question’s answer to 100 years.
This corresponds to a 1.4% growth rate, but you don’t need to use this number in your calculation.
… incident at the same rate/flux as at Earth
Water boils at , or 373 K.