Abstract
In this chapter, we explore how motion can affect the perceived frequency of waves, with significant implications for spectroscopy. We cover the broadening and shifting of atomic line frequencies due to atomic movement and investigate the roles of velocity and temperature in these phenomena. Key topics include the Doppler effect, Doppler broadening, the Maxwell-Boltzmann velocity distribution, and the Equipartition Theorem. Additionally, the chapter discusses the application of the Doppler effect in astronomy.
Keywords: Doppler effect, Doppler shift, Doppler width, Doppler profile, Maxwell-Boltzmann velocity distribution, Transmission and absorption plots
Learning Goals
By the end of this chapter, you should be able to understand:
the Doppler effect.
Doppler broadening and how temperature affects the spectral features in absorption and transmission plots.
the Maxwell-Boltzmann velocity distribution.
how the temperature of a vapor cell is related to the average speed of an atom in that cell.
the application of the Doppler effect in astronomy.
4.1 The Doppler Effect
The Doppler effect is likely a phenomenon you have encountered before. When an ambulance, police car, or racecar travels past you, the sound you hear changes pitch. This happens because the motion of the vehicle compresses or extends the sound waves. Figure Figure 1 shows the sound waves emitted by a stationary ambulance (left) and a moving ambulance (right). Let’s focus on the stationary ambulance. Imagine that you are standing in front of or behind the ambulance. The wavelength of the sound wave that hits your ear is the same for both scenarios, so you would hear the same pitch independent of where you are standing. Now, imagine the ambulance is moving. If you were standing in front of the ambulance (OK, maybe a bit to the side …we don’t want you to get hit, even in a thought experiment), the wavelength of the sound wave that reaches your ear is shorter compared to the stationary ambulance. If you were standing behind the moving ambulance, the wavelength is longer compared to the stationary ambulance. The formula that relates the frequency (pitch) that you hear to the wavelength should look really familiar. It is , where is the speed of sound in air (replace with c and you have Eq. (1) from p. 19). The apparent shift in frequency due to an object moving is known as the Doppler effect, named after Austrian physicist and mathematician Christian Doppler. It is a very important concept in spectroscopy.
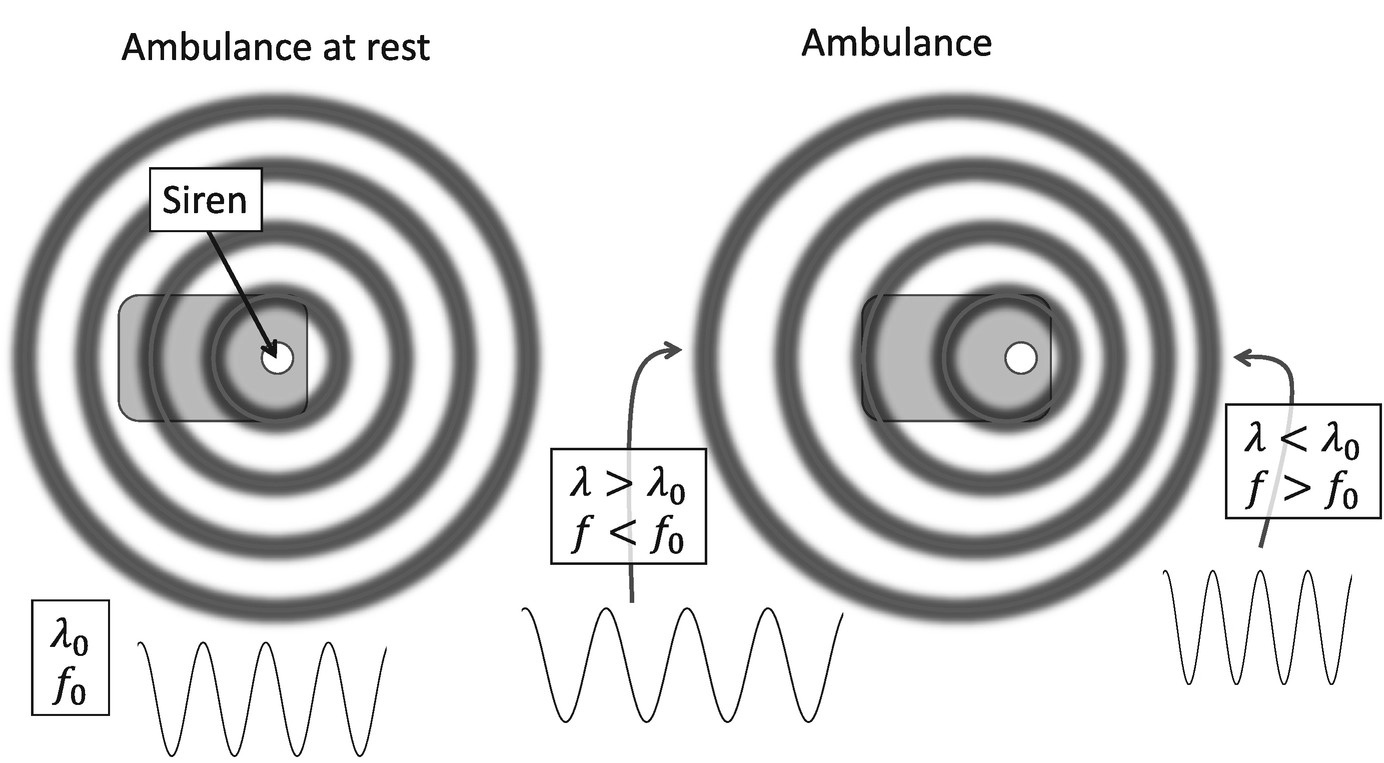
Figure 1:Left: An ambulance at rest emitting a sound wave from its siren. The wavelength and frequency of the sound wave is the same in all directions. Right: Now the ambulance is moving to the right. The sound wave in front of the ambulance is compressed, which means the perceived wavelength is smaller and the perceived frequency is larger (higher pitch). The sound wave behind the ambulance is expanded, which means the perceived wavelength is larger and the perceived frequency is smaller (lower pitch)
The Doppler effect occurs for any type of wave. Whether it is a sound wave, a light wave, or a water wave created by a duck swimming in a pond, the relative motion of the object with respect to the observer will change the wavelength, and thus the frequency of the wave. The EMT driving the ambulance hears no change in pitch because they are stationary with respect to the siren. If you yelled positive encouragement at the ambulance as it passed, the driver would hear your pitch change as they passed by you. Likewise, you don’t hear your pitch change as the ambulance passes by you. What is important here is that the Doppler effect is something experienced by the observer because the source of the wave is moving with respect to them.
4.2 Laser Frequency From an Atom’s Perspective
What does this have to do with spectroscopy? In Chap. 3. Atoms at Rest, we made an important statement after analyzing Eq. (1) on p. 45. It is so important we will repeat it here:
Important Statement:
A photon has a probability of being absorbed by an atom depending upon the photon’s energy. It is most likely to be absorbed if the photon’s energy exactly matches the energy difference between the ground and excited state, but there is a non-zero probability of absorption off resonance.
Specifically, in the absence of any broadening mechanism (like laser power), if the photon’s energy is off by from that resonance energy, the photon is half as likely to be absorbed compared to a photon that has the energy that equals the energy difference between the ground and excited states.
Important Reminder
Frequency, energy, and wavelength are all the same quantity. Each of these parameters is related to the other parameters only by constants.
Imagine a laser beam traveling to the right, as shown in Fig. Figure 2. Also imagine there are three atoms: atom 2 is traveling to the left, atom 1 is stationary, and atom 3 is traveling to the right. For this thought experiment, we will assume the speeds of atom 2 and atom 3 are the same, just in opposite directions.

Figure 2:A simple experimental to explore how motion of atoms impacts the interactions between the atoms and laser light
In this experiment, the atom is the observer because it is interacting with the laser light and not producing it. To understand the Doppler effect, it is important to recognize that each atom perceives itself as stationary. Atom 2 would claim that atom 1 is moving to the right and that atom 3 is moving twice as fast as we (as the scientists looking from the outside) would say atom 3 is moving. Both atom 1 and us, as the observing scientists, will agree on the frequency of the laser. Because of the Doppler effect, atoms 2 and 3 will disagree. To make this idea a little clearer, let’s say that the laser frequency is (terahertz) and that this is the resonance frequency for the atom. Both the scientists and atom 1 will agree that the laser frequency is ; atom 1 will absorb photons from the laser beam. However, atom 2 and atom 3 will disagree with this claim since atom 2 is moving towards the laser and atom 3 is moving away from the laser.
Two Minute Question
Will atom 2 perceive the laser is higher in frequency or lower in frequency than what we and atom 1 perceive? Decide on an answer before reading on.
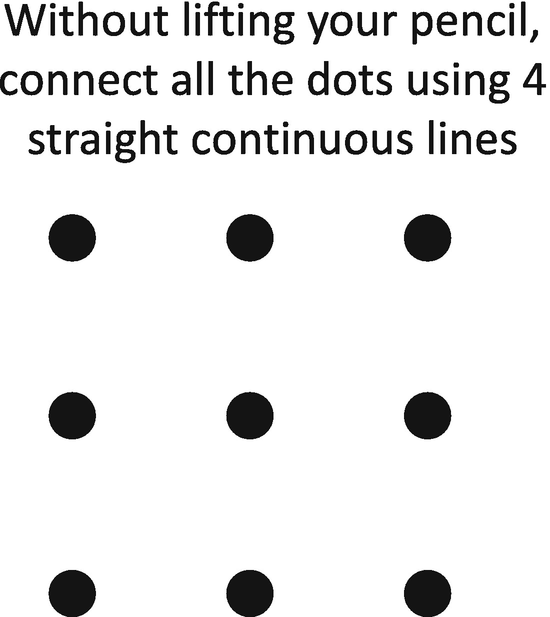
Answer Atom 2 is moving towards the laser source, so it will perceive the laser frequency as higher than it actually is. Atom 2 will only absorb a photon from the laser if it thinks the laser frequency matches the resonance frequency. Therefore, we, in the observing frame, need to set the laser frequency smaller than the resonance frequency so that the actual laser frequency plus the frequency shift due to the Doppler effect results in the resonance frequency in the frame of atom 2. In equation form, this is represented as:
where is the laser frequency according to atom 2, is the actual laser frequency (i.e. the frequency measured in the laboratory/stationary frame), and is perceived shift in frequency due to the Doppler effect. In this example, for atom 2, so if we want , then we need to set the laser frequency smaller than the resonance frequency such that .
Likewise, atom 3 is moving away from the laser source, so it will claim the laser frequency is lower. As a result, the actual laser frequency will have to be higher than the resonance frequency for atom 3 to absorb a photon.
Understanding the Doppler effect is really important in spectroscopy. Inside a gaseous sample of atoms some atoms are moving towards the laser, some are moving away, and some are not moving towards or away from the laser. As we, in the laboratory/stationary frame, change the frequency of the laser from below the resonance frequency to above the resonance frequency, we will find that atom 2 will absorb light at a different frequency than atom 1 or atom 3. Each atom will claim it is absorbing light at precisely the frequency needed to excite it from the ground state to the excited state, and each atom is correct! Atom 2 “sees” a higher frequency than the actual frequency of the laser. When atom 2 “sees” the correct frequency, it will absorb light. For us in the laboratory frame, the laser frequency is too low. This can be confusing, so here is a summary:
From atom 2’s reference frame, the frequency of the laser is just right to excite atom 2 from the ground state to the excited state.
From the laboratory reference frame, the frequency of the laser is too low.
The Doppler effect tells us that because atom 2 is traveling towards the laser beam, it will see a higher frequency than what we, as scientists in the laboratory/stationary frame, measure.
An Important Correction I simplified the above description by just a little bit. An atom moves in three dimensions, but only the component of the atom’s velocity in the direction toward or away from the laser beam contributes to the Doppler effect. An atom that isn’t moving toward or away from a laser can still be moving; it is just moving perpendicular to the laser. A more correct statement is: Inside a gaseous sample of atoms, some atoms have a velocity component pointing towards the laser, some atoms have a velocity component that is pointing away from the laser, and some atoms have no velocity components pointing towards or away from the laser.
We represent that velocity component with the parameter . It is defined to be positive if the atom is traveling away the laser and negative if traveling towards from the laser.
Definitions
Doppler shift: The shift in the frequency of a laser seen by an atom due to the Doppler effect.
: The velocity component of an atom in the direction of the laser beam. is negative if the atom is traveling towards the laser and positive if it is traveling away from the laser.
The frequency of laser light as seen by the atom is given by the formula:
where is the frequency of the laser as seen by the atom, is the frequency of the laser measured in the lab (rest) frame, and is the velocity component in the direction of (parallel to) the laser beam. Using , the right-hand side of Eq. (2) can be written as:
where is the wavelength of light measured in the laboratory frame.
Important
is a weird variable in that the sign of depends on whether the atom is moving towards () or away () from the laser. Messing up the sign of is a very common mistake when using this formula. When in doubt, just remember that an atom moving towards the laser beam sees a higher frequency.
Comparing Eqs. (1) and (3), we find the formula for the Doppler shift:[1]
A Bit More About Velocity Components The velocity component in the direction of the laser beam is an important, but sometimes confusing, idea when you first encounter it. So, let’s spend a bit more time thinking this idea through using Fig. Figure 4. In Fig. Figure 4a, the first atom’s velocity is pointing directly towards the laser, so . For this atom, there is no perpendicular component to the atom, . If the laser was traveling towards the left, for this atom because the sign of only depends upon if the atom is moving towards or away from the laser beam.
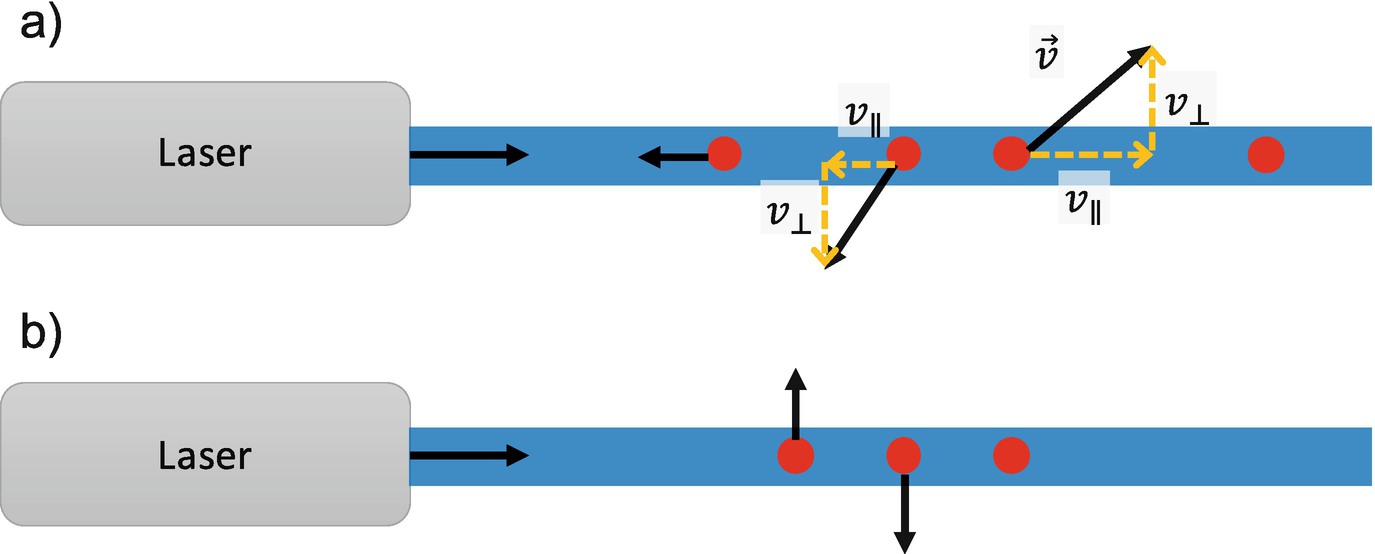
Figure 4:(a) Only the component of velocity in the direction of the laser beams results in a Doppler shift. The first two atoms have different velocities, but the same component in the direction of the laser, . As such, they will experience the same Doppler shift. The third atom has a velocity component in the opposite direction, so it will have a different Doppler shift. The last atom is completely stationary. (b) All three of these atoms have no velocity component in the direction of the laser, so they all have zero Doppler shift
The second atom has both a perpendicular component and a parallel component. Only the parallel component causes the Doppler shift, and the parallel component tells us the atom is moving towards the laser source, so . Notice the parallel component for the two first two atoms are the same size and pointing in the same direction. Therefore, they will have the same Doppler shift.
The third atom has a perpendicular component, which we don’t care about, and a parallel component pointing away from the laser, so . This atom will absorb photons with a different laser frequency than atoms 1 and 2. The last atom is not moving at all. It has no perpendicular or parallel component: and . Figure Figure 4b shows three examples of atoms with . Each of these atoms will absorb photons when .
Important
In high precision spectroscopy, we want to extract information from atoms that have . The rest of the atoms in our sample make our spectrum less precise. How the Doppler shift changes an absorption plot is going to be explored in the rest of this chapter. Chapter 5. Saturated Absorption Spectroscopy introduces a clever experimental trick known as saturated absorption spectroscopy. This technique allows us to remove the issues brought about from the Doppler shifts that we are about to discuss.
4.3 How the Velocity of an Atom Affects the Spectral Feature
Let’s go back to a simplified picture where we have 3 atoms.

Atom 1 is at rest, atom 2 is traveling towards the laser at speed v, and atom 3 is moving away from the laser at the same speed as atom 2. For this thought experiment, each atom that experiences a Doppler shift will have .
What do the transmission and absorption plots look like? Spend a few moments thinking about it, make a prediction, and then read on! Hint: There are only 3 atoms, so the fraction of light lost is very, very small.
The answer is shown in Fig. Figure 6. There are three spectral features. Each spectral feature is identical except for a horizontal offset determined by the Doppler shift formula. Since atom 2 is traveling towards the laser beam, it perceives a higher laser frequency compared to what we measure in the lab. Therefore, atom 2 will absorb photons when the laser frequency is below the resonance frequency. The spectral feature from atom 2 is at . Likewise, atom 3 is traveling away from the laser, so it is seeing a lower laser frequency compared to what we measure in the lab. Therefore, atom 3 will absorb photons when the laser frequency is above the resonance frequency. The spectral feature for atom 3 is at . This important information is summarized in Table Paragraph.
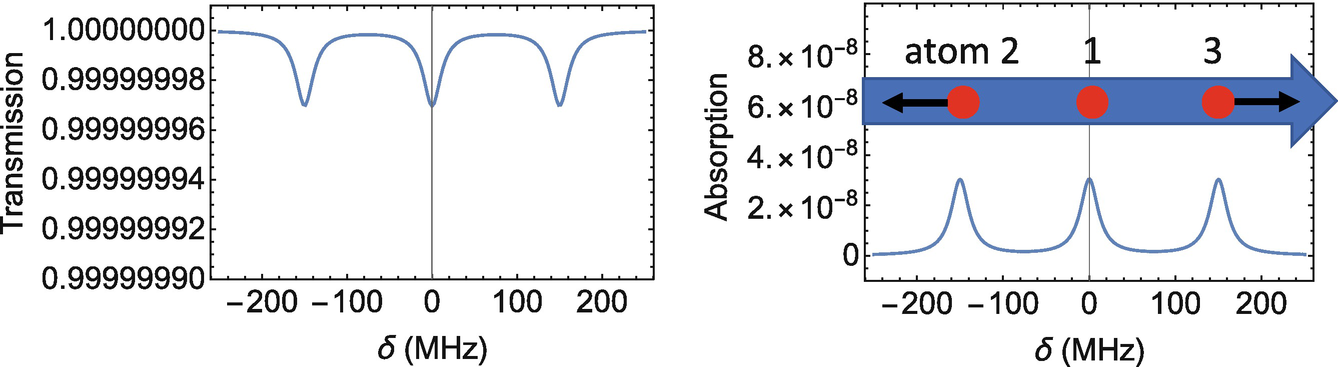
Figure 6:A simulated transmission plot (left) and absorption plot (right) for the three atoms
Table 4.1 A table summarizing the Doppler shifts for the 3 atoms
| Atom 2 | Atom 1 | Atom 3 | |
|---|---|---|---|
| Motion | Towards laser | Stationary | Away from laser |
| The atom sees | Higher frequency light | Actual laser frequency | Lower frequency light |
| Resonance happens | At lower frequency | At actual frequency | At higher frequency |
In a real vapor cell, atoms are moving with all sorts of different velocities. Unlike energy levels in an atom, velocity is a continuous variable. In the next two sections, we are going to discuss the distributions of velocities inside a real vapor cell (Sect. 4.4 The Maxwell-Boltzmann Velocity Distribution) and use that information to develop what the transmission and absorption plots look like for a vapor cell of atoms at a given temperature (Sect. 4.5 Transmission and Absorption Plots for Atoms at a Non-Zero Temperature).
4.4 The Maxwell-Boltzmann Velocity Distribution
Within a gaseous cloud of atoms, there is a distribution of velocities. This distribution depends on the temperature and mass of the atoms. The distribution of velocities in the direction of the laser beam, which is known as the Maxwell-Boltzmann velocity distribution,[2] is shown by the blue line in Fig. Figure 7. The Maxwell-Boltzmann velocity distribution often uses the function to represent the distribution of velocities. This is not the f we use for frequency. A good rule of thumb is that if it is a function, like , the “f” is probably referring to a distribution. If the “f” is all by itself in a formula, it is probably referring to a frequency.
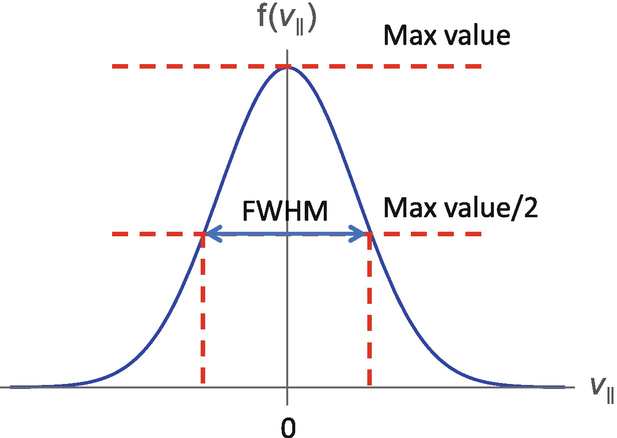
Figure 7:A cloud of gaseous atoms will have a distribution of velocities given by this graph. This distribution, which is derived from thermodynamics, is known as the Maxwell-Boltzmann velocity distribution
The full width at half maximum of a Maxwell-Boltzmann velocity distribution, which is a velocity with units m/s, is:
where is the Boltzmann constant, T is the temperature of the gas (the unit is kelvin), and m is the mass of an atom in the gas (the unit is kilogram). The hotter the gas, the wider the velocity distribution, and thus the larger the average speed of the atoms in the gas. The mass of an atom is in the denominator, so atoms with larger masses have smaller average speeds compared to an equally hot gas of smaller mass atoms.
How to Use Distributions This section isn’t really needed to understand the velocity distribution. However, distributions are incredibly important in many areas of science, so I wanted to spend a bit of time talking about how we use them. The velocity distribution represents the fraction of atoms that fall within a particular velocity range. Since an atom must have some velocity, the total area under the curve in Fig. Figure 7 is 1. This is equivalent to saying that each atom must have some velocity between and .
To use a distribution, you ask questions like, “What fraction of atoms have a positive parallel velocity component?”, “What fraction of atoms have a parallel velocity component between 2 and 10 m/s?”, or more generally, “What fraction of atoms have a parallel velocity component between and ?”, where and are any velocities we choose.
The answer is the area under the distribution between and . If we want to know the total number of atoms from the sample that have velocity components between those two values, we multiply that fraction by the total number of atoms in the sample. For example, here are three plots with different choices of and :
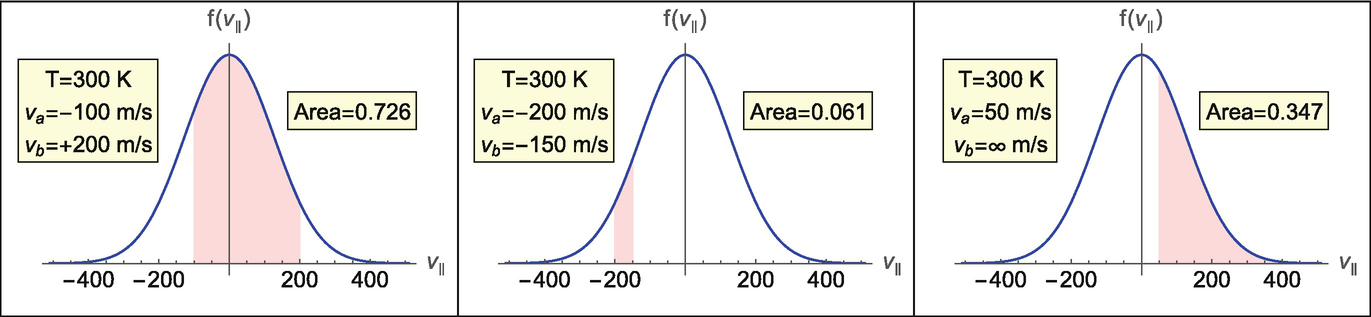
Suppose we have 5000 atoms in our sample. As shown in the first plot, there are with parallel velocity components between and . As shown in the second plot, there are with parallel velocity components between and , and in the third plot there are with parallel velocity components larger than 50 m/s.
Important Reminder
Due to the Doppler effect, atoms with different velocities will absorb photons at different laser frequencies.
The mathematical function that describes the shape of the Maxwell-Boltzmann velocity distribution is a Gaussian function given by:[3]
A Gaussian looks similar to the Lorentzian function that models the shape of a spectral feature, but the two functions are different. Figure Figure 9 shows a plot of both a Gaussian function and a Lorentzian function with the same area and FWHM. Notice the Lorentzian has larger “tails” and is more spread out compared to the Gaussian function. Both functions are very common in physics and math.
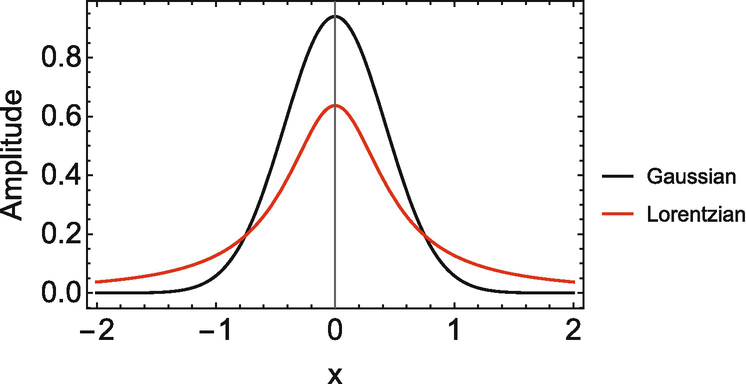
Figure 9:A comparison between a Gaussian function and a Lorentzian function. Each function has an area under the curve of 1 and a FWHM of 1
Extra Math for Those Who Have Taken Statistics In statistics, Gaussian functions are written as , where is called the standard deviation. For the Maxwell-Boltzmann velocity distribution, the standard deviation is . The FWHM of a Gaussian function defined using the standard deviation is:
4.5 Transmission and Absorption Plots for Atoms at a Non-Zero Temperature
Definitions
Doppler broadening: The widening of a spectral feature due to a vapor cell having a given temperature.
Doppler profile: The name given to a spectral feature that is broadened because of temperature.
Doppler width: The FWHM of a Doppler profile.
In Sects. 4.2 Laser Frequency From an Atom’s Perspective and 4.3 How the Velocity of an Atom Affects the Spectral Feature, we explored a transmission plot with only three atoms with different velocities. What if we had one hundred thousand atoms? Figure Figure 10 shows the results for a simulation of transmission plots as we add more and more atoms to a vapor cell. For this simulation, I assumed that we had a two-level atom with a mass of (this is the mass of a nitrogen atom), a vapor cell temperature of , an excitation wavelength of (), and a natural linewidth of . I randomly picked a velocity component using the Maxwell-Boltzmann velocity distribution for each atom I add to the cell.
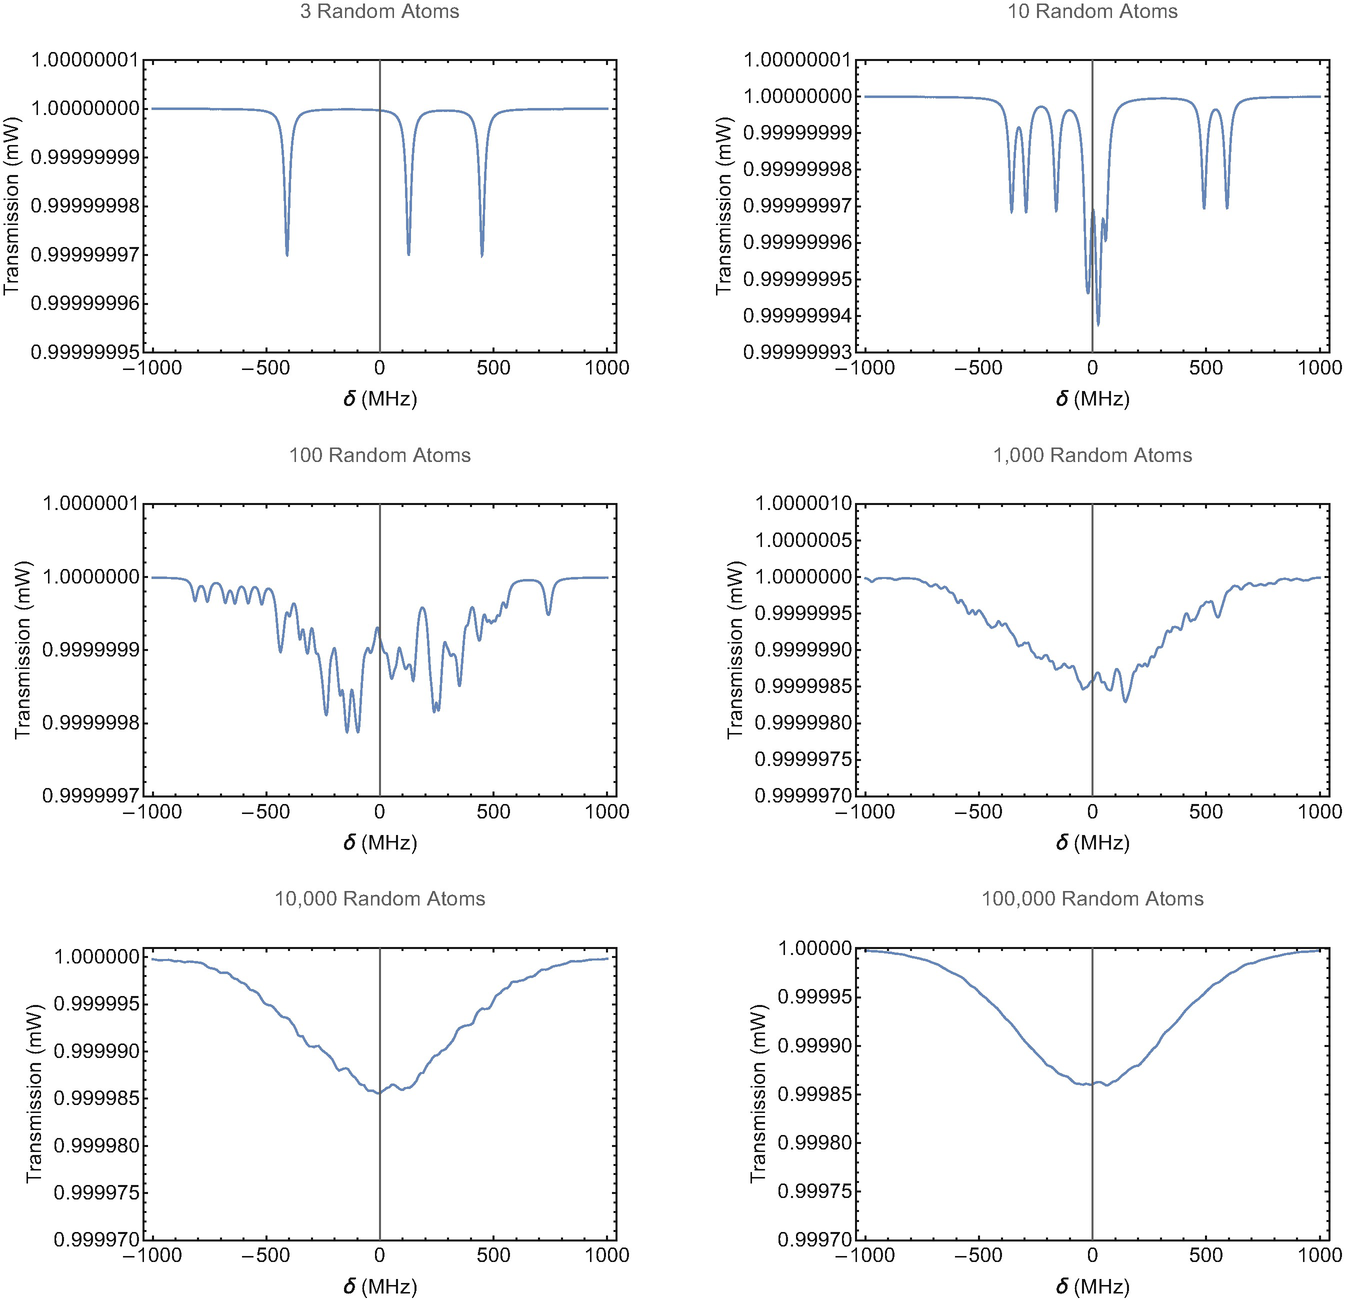
Figure 10:Building a Doppler profile from individual atoms
Note that each transmission plot has a different vertical scale. Individually, a single atom isn’t going to absorb a large fraction of a laser’s photons. However, the more atoms you have interacting with the light, the more spectral features you have piling up on each other. Ultimately, you get a transmission plot that looks like it has a single feature.
This feature, which is called a Doppler profile, is much wider than a spectral feature from a single atom and is pretty close to the same shape as , where A is some constant and is the Maxwell-Boltzmann velocity distribution. Notice the center of the Doppler profile is still at the resonance frequency .
The width of a Doppler profile can be found from FWHM of the Maxwell-Boltzmann velocity distribution, which is a velocity. We can convert this velocity to a frequency using the Doppler shift formula. The FWHM of a spectral feature broadened by temperature, which is called the Doppler width, is given by the formula:
where is the Doppler width, which has frequency units.
4.6 The Equipartition Theorem
There is a neat theorem from thermodynamics known as the Equipartition Theorem. Before discussing the Equipartition Theorem, we need to understand kinetic energy. Kinetic energy is the energy of movement. Any object with mass m and speed v has kinetic energy:
Since kinetic energy is a type of energy, the unit is a joule. Imagine you have 3 atoms in your gas. We will assume that all the atoms have the same mass but different speeds. The average kinetic energy of the atoms in the gas would be:
If we had N atoms in our gas, all with the same mass, the average kinetic energy would be:
That last term that is in parentheses is called the average squared speed. We denote this last term as . In fact, whenever you see the mathematical expression between two angle brackets, , you are being asked to take the average of that property. has a special name which is called the root mean squared speed , which you may have learned about in high school Chemistry. Putting this all together, we find that the average kinetic energy of all the atoms in the gas is:
Reading the Above Equation For a gas composed of atoms with the same mass, the average kinetic energy of the atoms is proportional to the average squared speed.
The Equipartition Theorem tells us that the energy of a gas is equally distributed among all “degrees of freedom.” Degrees of freedom indicate the number of ways an atom or molecule can move. Atoms have three degrees of freedom because they can move in three dimensions. Molecules have more degrees of freedom because they can rotate and vibrate, so a molecule has more ways to distribute its energy than an atom. The Equipartition Theorem tells us that each degree of freedom has of energy. In this book, we are only working with atoms, but, in the future, if you work with molecules, the following formulas will be slightly different.
Imagine you have a vapor cell of atoms at some temperature T. The average kinetic energy of the atoms in the gas is:[4]
The 3 on the right hand side represents the three degrees of freedom of an atom . This formula is very useful because it directly relates the temperature of a sample of atoms to a characteristic speed of the atoms, specifically .
4.7 Application to Astronomy: Light from the Stars
In our experiment, both we, the scientists, and the laser light source are stationary while the atoms, which act like the observers of the laser light, are moving. The same principles of the Doppler effect apply whether the light source is moving and the observer is stationary, the light source is stationary and the observer is moving, or if both are moving. All that matters is whether the source and observer are moving towards each other or away from each other.
The Doppler effect is a powerful tool in astronomy. Suppose we are using a telescope to collect light from a distant star that is mostly composed of hydrogen gas. That star is emitting light with frequencies corresponding to the difference of the hydrogen energy levels. We now know that if the star is moving towards us, the frequency of light leaving that star will look to us to have a higher frequency than what we would observe if we just had a hydrogen light bulb in our lab. In astronomy, this phenomenon is called blue-shifted light because the light has a higher frequency than we would expect if we measured the spectrum of hydrogen here on earth. If the star is moving away from us, which is far more common in astronomy, the frequency of light that is emitted from the star looks to be lower frequency compared to what we would measure from a source here on earth. This is called red-shifted light.
In summary, if the star is moving towards us, we will see a spectrum that is shifted to higher frequencies compared to what we measure in the lab (blue-shifted; ), and we will see a shift to lower frequencies if the star was moving away from us (red-shifted; ).
The Doppler effect allows us to calculate the speed of that galaxy. The Doppler formula for a star moving towards (or away) from the earth has a slightly different form than Eq. (3):
where is the Doppler shifted frequency measured on earth, is the frequency of the light emitted from the star, and v is the speed of the star or galaxy in the direction of earth. Astronomers also use the parameter to describe blue-shift light (; the star is moving towards the earth) and red-shifted light (; the star is moving away the earth). You will have the opportunity to derive this formula in Problem Exercise 4.7.
Finally, astronomers like to use wavelength instead of frequency. Writing Eq. (14) using wavelength and solving for z gives:
4.8 Problems
The full formula is , where v is the speed of the atom and is the angle between the laser and the velocity of the atom ( for an atom moving in the same direction as the laser and rad for an atom moving in the opposite direction). The component of the velocity in the direction of the laser is . If you have worked with vectors before, you might recognize these as vector components.
Named after the Scottish mathematician James Clerk Maxwell and the Austrian physicist Ludwig Boltzmann.
This is a distribution for 1 dimension since we are only interested in the velocity component for a single direction. In the future, you might encounter a Maxwell-Boltzmann velocity distribution that has a power of 3/2 instead of 1/2 on the expression in front of the Gaussian function. That would be a velocity distribution for all components of velocity, not just the parallel component.
You can derive this formula from the Maxwell-Boltzmann velocity distribution, but you will need to use calculus.
Image and data is from the Sloan Digital Sky Survey. Funding for the Sloan Digital Sky Survey (SDSS) has been provided by the Alfred P. Sloan Foundation, the Participating Institutions, the National Aeronautics and Space Administration, the National Science Foundation, the U.S. Department of Energy, the Japanese Monbukagakusho, and the Max Planck Society. The SDSS Web site is http://
www .sdss .org/. The SDSS is managed by the Astrophysical Research Consortium (ARC) for the Participating Institutions. The Participating Institutions are The University of Chicago, Fermilab, the Institute for Advanced Study, the Japan Participation Group, The Johns Hopkins University, Los Alamos National Laboratory, the Max-Planck-Institute for Astronomy (MPIA), the Max-Planck-Institute for Astrophysics (MPA), New Mexico State University, University of Pittsburgh, Princeton University, the United States Naval Observatory, and the University of Washington.