Abstract
In this chapter, we explore how light from sources such as the sun or a lamp can be dispersed into its spectral components. We discuss various dispersive elements, including gratings and prisms, and the phenomena of refraction and diffraction that allow these elements to spatially separate light. The chapter explores blackbody radiation and the historical significance of the ultraviolet catastrophe. Additionally, we introduce the concepts of absorption and emission lines, which provide insights into atomic and molecular energy levels.
Keywords: Spectrum · Blackbody radiation · Diffraction · Refraction · Gratings · Absorption spectroscopy · Spectral analysis
Learning Goals
By the end of this chapter, you should be able to understand:
the concept of spectral components and how white light is composed of various wavelengths of light.
the function and importance of dispersive elements like prisms and gratings in spectroscopy.
the difference between refraction and diffraction.
blackbody radiation and the ultraviolet catastrophe.
the principles of emission and absorption lines in spectroscopy and their significance in understanding atomic structure.
the Stefan-Boltzmann law and Wien’s displacement law in the context of blackbody radiation, and how to determine temperature from the blackbody spectrum.
how light collected from the sun gave us our first evidence of atomic energy levels.
2.1 Breaking Light into a Spectrum
Definitions
Spectral component: “White” light is made up of many different wavelengths of light. Even light from the sun, which looks yellow, is made up of many different wavelengths of light. A single wavelength of light that makes up a broader spectrum of light is called a spectral component.
Dispersive element: Anything that spatially separates light into its spectral components.
Spectrometer: Any tool that allows us to separate out and measure the amount of each spectral component.
Refraction: the redirection of a wave as it passes from one medium to another medium (like air to water).
Diffraction: when waves bend around the corners of an obstacle.
A spectrometer only needs two items: a dispersive element and a screen. A dispersive element is anything that takes light and spatially separates it into its spectral components. A common dispersive element is a prism, as shown in Figure 1, which works due to refraction. If you send white light into a dispersive prism, you will see a rainbow exiting because each spectral component refracts at a different angle. For a prism, the smaller the wavelength of light, the larger the refraction angle. So, blue light ( 400–490 nm) refracts at a larger angle than red light ( 620–750 nm). If you calibrate the prism so that you know at what angle each wavelength refracts, you can send in an unknown wavelength, measure the angle of refraction, and use math to determine the wavelength of the light. You can also send in light from, for example, a hydrogen lamp and see what wavelengths or spectral components are in that light. Knowing how each wavelength refracts allows you to determine what wavelengths make up the hydrogen lamp spectrum.
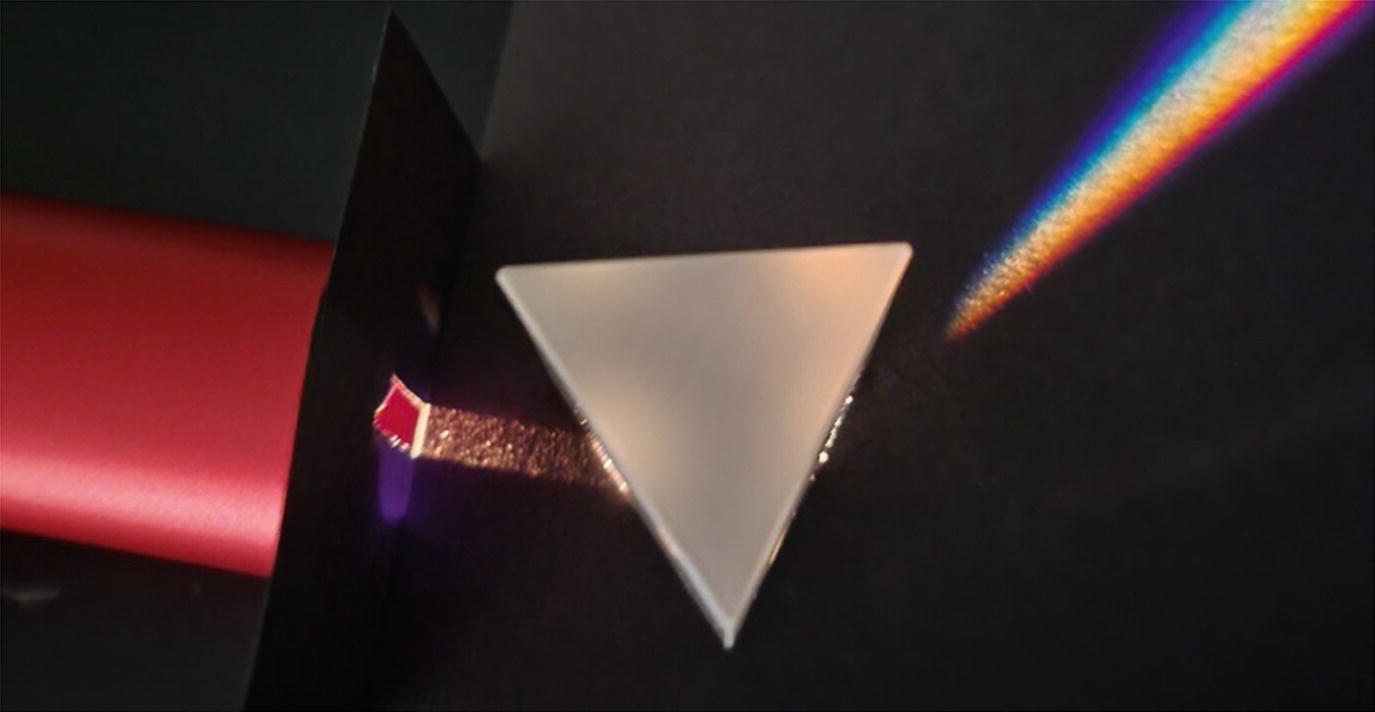
Figure 1:A dispersive prism takes white light, which enters the prism from the left, and makes a rainbow. Each wavelength is refracted at a different angle. The white light source I used to make this picture is a tungsten lamp
In spectroscopy, the most common dispersive element is an optical grating, which works due to diffraction. Optical gratings commonly come in two types: transmission and reflection, see Figure 2. Either way, the optical grating is a dispersive element that will spatially separate light into its spectral components because each spectral component diffracts at a different angle.
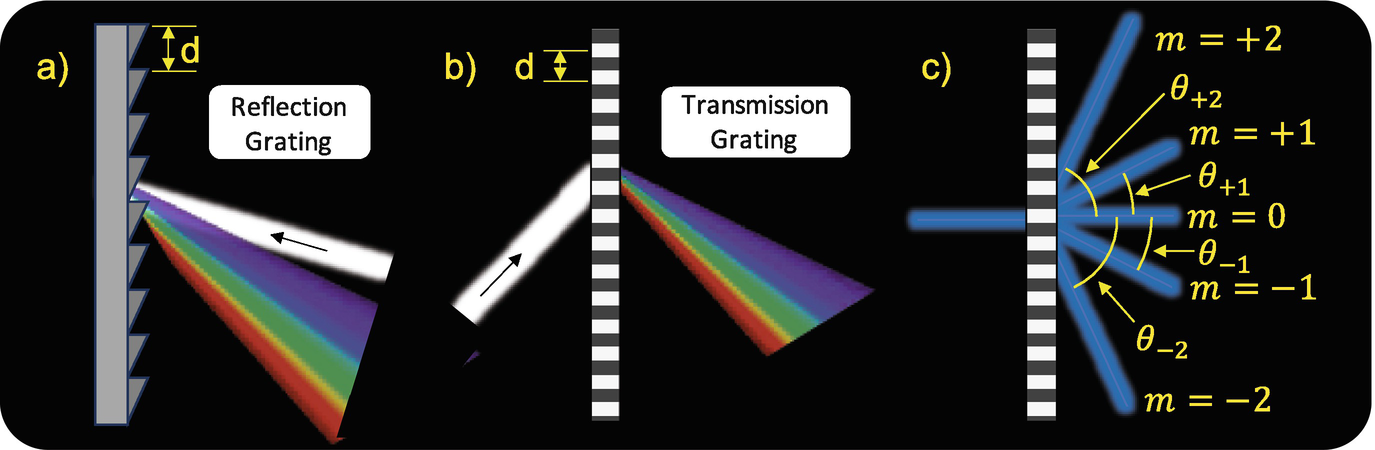
Figure 2:(a) An example of white light, which is composed of many spectral components, reflecting off a reflection grating. For illustrative purposes, d, which is usually very small, is greatly enlarged. We also only show one order to keep the example a little cleaner. (b) An example of white light diffracting through a transmission grating. Again, d is greatly enlarged and we only show one order. (c) An example of blue light with hitting perpendicular to the transmission grating and being diffracted. In this example, we show all diffraction orders. The angles of diffraction are calculated using (1)
To create the diffraction, both types of gratings have small structures separated by a distance d. A reflection grating has a bunch of small tilted mirrors called rulings while a transmission grating has a bunch of small slits. The only physical criterion for a grating is that . The size of d in Figure 2 has been greatly enlarged for visual purposes. While d must be larger than , in practice we also make sure that d is typically less than about to ensure suitable diffraction angles.
We will start with the equations that describe how spectral components are diffracted through a transmission grating; we will find that each spectral component can be diffracted at multiple, but well defined, angles. The math behind the next equation is a little complicated, but the end result is really what we care about. Let’s start by keeping things simple and assume the incoming light is perpendicular to the grating, see Figure 2c. The light diffracts through the grating according to the equation:
In this equation, d is the distance between the slits, m is an integer known as the diffraction order (the fact that a spectral component diffracts at multiple but well defined angles is mathematically represented by m), is the wavelength of a spectral component of the light, and is the angle of diffraction for order m. m can be a negative integer, zero, or a positive integer. If you know d and m, you can then measure and use that to calculate .
Example
A transmission grating has . There are three laser pointers: a blue laser pointer with , a green laser pointer with , and a red laser pointer with . All three lasers hit the grating perpendicular. What angles do the three lasers diffract for m = +1, 0, 1, and +2?
First, we use the diffraction equation to solve for : , where is the inverse sine function. For , we plug in numbers to find , , . So, let’s not use the diffraction order since we can’t learn anything here!
For , we plug in numbers to find . That is a pretty big difference! Your light only needs to travel a short distance to separate out the three colors.
Quick Math Aside
Let’s put the screen from the grating. On the screen is a ruler that will serve as our z-axis. If the grating wasn’t in place, all spectral components would hit the screen at the same place. Let’s call this spot . With the grating in place and the white light hitting the grating perpendicular, the blue light, which diffracts at , hits the screen at while the green light hits the screen . You could also skip the angle calculation and use the formula:
where L is the distance between the diffraction grating and the screen. z is positive for positive m and negative for negative m. You have the opportunity to derive this formula in problem 2.4. Notice that the diffraction order in the denominator is squared, so the sign of m only determines the sign of z.
For , we plug in numbers to find , , .
For , we find something interesting when we plug numbers into a calculator: . Blue light diffracts at , but the other two have weird looking answers that came out of my calculator. These numbers are called complex numbers. Complex numbers are a huge topic in both math and physics, but what it means for us is that green and red light cannot diffract into the order. Experimentally, we would see blue light diffracted at , but we would not see second order diffraction for red light and green light. They just wouldn’t be there. In general, whenever you calculate a number that is supposed to represent something physical and you get a complex number, that means this is something you cannot measure or it doesn’t exist.
From this example, we would want to design our spectrometer to use either or because all spectral components diffract with a real, measurable angle (i.e. not a complex number). In the end, it doesn’t matter which diffraction order we pick. As long as we know the angle at which a spectral component diffracts, we can use that information to determine the wavelength of an unknown spectral component.
A reflection grating does a similar job as a transmission grating, but the equation looks slightly different:
All that is different is the minus sign on the righthand side. Finally, let’s suppose the incoming light isn’t perpendicular to the grating but hits the grating at an angle with respect to the perpendicular (in optics, the perpendicular is called the “normal”), see Figure 2b. The formula describing the diffraction of a spectral component is:
While this formula is more complicated, it is important to note that the concept is far more important than the formula. The concept is simply this:
Take Home Message
If you know how your dispersive optic bends (diffracts or refracts) different wavelengths of light, you can use that information to determine the wavelength of an unknown spectral component from any light source.
Fun History
The first known exploration of a diffraction grating was by the Scottish mathematician and astronomer James Gregory in the mid 1600s. He observed the diffraction of sunlight caused by light passing through a bird feather. The individual feathers acted like the small slits of a transmission grating. The German physicist Joseph von Fraunhofer made the first diffraction grating in 1814. He discovered something amazing, which is the topic of the next section.
Diffracting light from a light bulb whose gas is a particular element like hydrogen, nitrogen, or oxygen is the topic of 2.3 Discharge Lamps. Classical physics had no way of explaining the observed spectral components, and this mystery was one of the puzzling experiments that led to quantum mechanics.
2.2 Blackbody Radiation
I pointed a commercial spectrometer at the sky, see Figure 3. Collecting this data was spectroscopy! A few important notes before we continue:
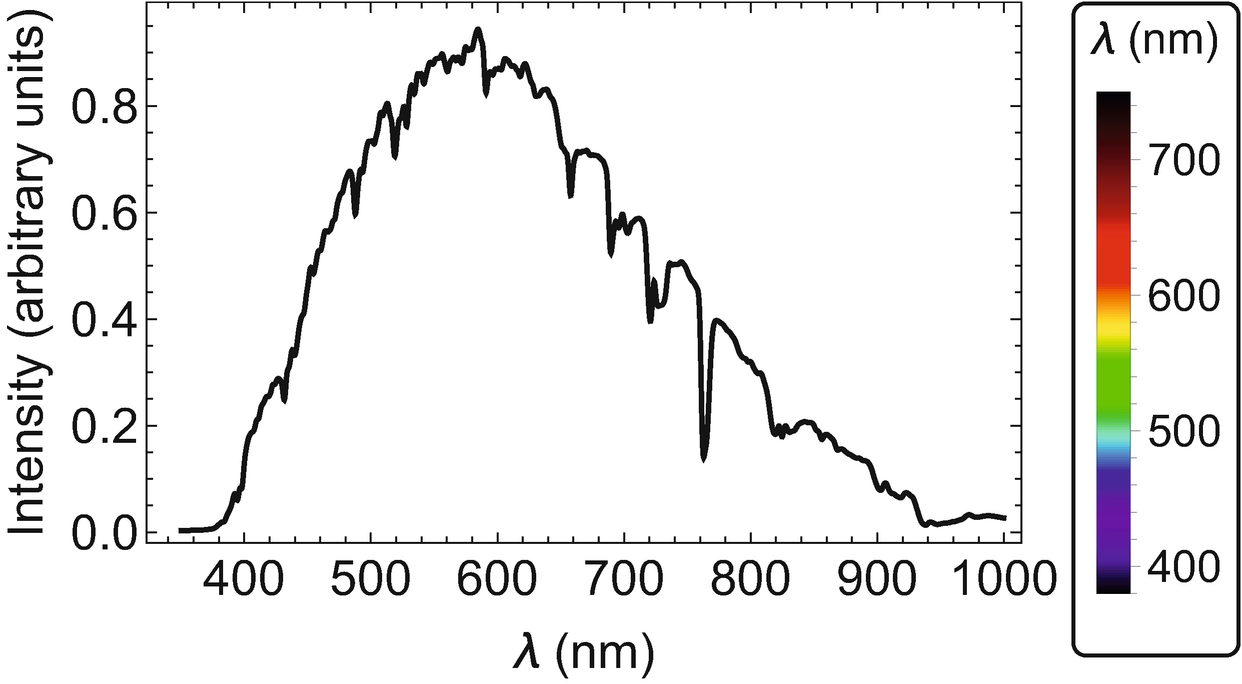
Figure 3:The spectral components of light from the sun after it passes through the atmosphere
This spectrometer has a dispersive element that was pre-calibrated, so the angle the light hits the detector is automatically converted to a wavelength.
Spectrometers are not uniformly sensitive. This means that the detector you are using might be more sensitive to red light than blue light. Graphs like Figure 3 are useful for identifying the wavelengths present in the light, but unless the detector has been calibrated to correct for wavelength sensitivity, the shape may be incorrect. In fact, the real spectrum of the sky goes to far longer wavelengths, but this spectrometer is not sensitive to light at those frequencies.
When this type of spectrum was first taken in the 1800s, those dips were a mystery, and physicists love a good mystery. Whenever a physicist is presented with data, the first thing they ask themselves is, “Why does the data look the way it does?” If we understand the concepts, we should be able to produce a mathematical model to describe (and predict) the data.
For this data, there are, at least, two things that need to be thought through. The first is the overall shape. The second is, what are those dips?
Historically, it was a fun journey to figure out the overall shape. Physics known in the 1800s predicted a far different shape. In fact, when challenged with describing the overall shape, physics failed hard. When physicists tried to predict the spectrum in Figure 3, the model was close for large wavelengths but very, very wrong for small wavelengths. Starting at the larger wavelengths and moving to shorter wavelengths, the math says the spectrum should get larger and larger and larger instead of turning around and getting smaller, which would require infinite energy. The dramatic result of the math is this: the universe doesn’t exist. Whenever the model says the universe doesn’t exist, there is something we don’t understand.[1] This result is now known as the “ultraviolet catastrophe.” It is a dramatic name, but the predictions from the mathematical model were also dramatic. We clearly needed a better model!
A Short Aside
Imagine you had a room with perfectly reflecting, parallel walls. Only light with particular wavelengths that create standing waves (perfect constructive interference like in Figure 8) can exist in this room. Even though only certain wavelengths are allowed in the room, there are still an infinite number of them (you can always add one more loop to the standing wave). According to classical thermodynamics, a well tested and very successful theory, each standing wave has the same amount of energy. If you learned about heat capacity in high school chemistry, this classical thermodynamics model predicted an infinite heat capacity. Yikes!
According to the model, since each mode has the same energy, Figure 3 should keep going up and up at small wavelengths. As a practical example, this mathematical model says that if you stood in a closed room and lit a match, the entire room and everything in it would burst into flames due to the infinite energy density at short wavelengths. Ultraviolet catastrophe indeed!
In 1901, after a lot of thought and model development, German physicist Max Planck eventually figured out that if light was composed of photons, then there would be way fewer higher-energy photons than lower-energy ones, which solved the problem. In 1905, German born physicist Albert Einstein built upon this idea with the photoelectric effect. The mathematical result of this new model predicted the shape in Figure 3, which is modeled by the complicated formula:
where is Planck’s constant, c is the speed of light, is a constant known as Boltzmann’s constant,[2] and T is the temperature of the object. For temperature, we use the unit kelvin, which is named after British mathematician, physicist, and engineer Lord William Thomson. The unit for Boltzmann’s constant is joule/kelvin. Using this model to fit the data from the spectrometer, we can measure the temperature of the surface of the sun to be about 5800 kelvin. We call “spectral radiant exitance”, and it tells us how much radiant energy per second is leaving the object per unit area per unit wavelength.[3] The units for are . I should note that this equation is for a “perfect” blackbody, which doesn’t exist in real life. Not having a perfect blackbody is equivalent to saying there is no such thing as a room with perfectly parallel and reflective walls. However, it still does a pretty good job with modeling the spectrum emitted by objects.
It isn’t just the sun that emits a blackbody spectrum. A hot pan on the stove does, you do, and I do as well. The amount of light that is emitted as well as the peak wavelength of the blackbody spectrum only depends upon the temperature of the object. Remarkably, everything else in this model is either a constant or wavelength, which is our horizontal axis. Figure 4 shows a few different plots of the spectral radiant exitance for different temperatures. For objects near 5000 K, like the sun, they emit light that is visible to our human eye. For cooler objects, like us, the maximum spectral radiant exitance occurs more near , which is . There are special cameras that can see this wavelength of light. You may have seen thermal imaging or watched the Predator movies. I did not include the vertical scale in this plot because the numbers are big and hard to interpret without really digging into the spectral radiant exitance formula. But hotter objects do emit more light. The maximum spectral radiant exitance for a 6000 K object is about 3 million times larger than for a 310 K object.
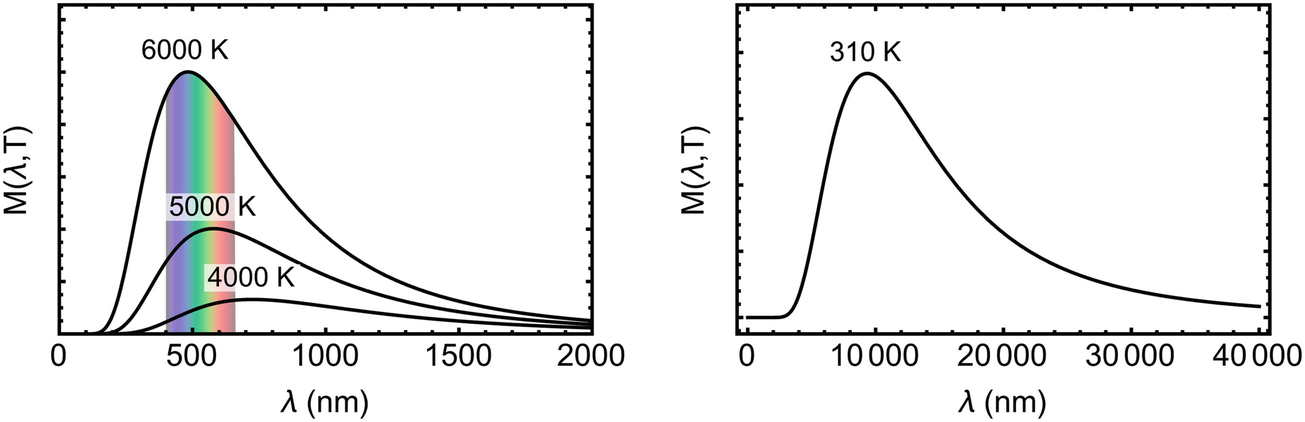
Figure 4:Left: Blackbody spectrum for very hot objects. The surface of the sun is 5800 K. Right: Your blackbody spectrum, assuming you are human (310 K is about 98 F). Notice the horizontal axis is a very different scale
The Stefan–Boltzmann Law and Wien’s Displacement Law
Imagine you have a blackbody with surface area A. Besides the spectrum of the blackbody, you can also measure the total power emitted by the object. The total power emitted is proportional to the area under a spectral radiant exitance graph. After some math (calculus), the total power emitted by a blackbody:
where is a constant known as the Stefan–Boltzmann constant,[4] is the emissivity, and A is the surface area of the object. Emissivity is a number between 0 and 1 indicating how closely the object behaves like a blackbody. If it is a perfect blackbody, . For a sphere, like the sun, the surface area is , where R is the radius of the sphere. The emissivity of the sun is about 0.99, so it is nearly a blackbody.
Several years before Max Planck solved the ultraviolet catastrophe, German physicist Wilhelm Wien experimentally noticed that the wavelength of the maximum spectral radiant exitance graph, see Figure 4, was inversely proportional to temperature. He discovered that a blackbody with a temperature of 6000 K had a maximum around nm, 5000 K had a maximum around 580 nm, 4000 K around 725 nm, etc. After studying the trend between temperature and peak wavelength, he determined:
where This formula was later derived from the spectral radiant exitance formula. If you have the calculus background to find the maximum of a function and want to derive this formula, you should know that, unfortunately, the resulting equation is a transcendental equation and thus does not have an analytical solution. However, you can find a numerical solution.
What About Those Dips?
Let’s return to the experimental data we took for the spectrum of the sky, see Figure 3. Blackbody radiation explains the overall shape, but what about the dips? What do you think is making those dips? The answer is below the fun little puzzle in Figure 5.
Figure 5:A fun little puzzle to separate the question from the answer
There are two sources of the dips: atoms and molecules in our atmosphere and the sun itself. For example, the dip near 750 nm is due to oxygen molecules in the atmosphere. There are photons coming from the sun that have the perfect energy to excite oxygen molecules. Because oxygen molecules absorb only photons with the perfect energy, some light is lost at very specific wavelengths before it reaches our spectrometer.
The second source for the dips is the sun itself. While the sun emits blackbody radiation, that light passes through gas at the surface of the sun. That gas absorbs light just like atoms and molecules in our atmosphere. If we wanted just the composition of the sun, we should collect this data from space!
This leads to one method of performing spectroscopy with a spectrometer. You take a light source, which can be a blackbody, a flashlight, or really any light source you want, and send it into your spectrometer. Record this spectrum. Next, place an atomic sample between the light source and the spectrometer and record this spectrum. Comparing the two spectra tells you which wavelengths got absorbed. Each wavelength that is lost from the light due to absorption is the same wavelength needed to excite the atom from one energy level to another. So measuring these absorption dips gives you information about the energy levels of the atoms.
2.3 Discharge Lamps
Another method of spectroscopy using a spectrometer is to point the spectrometer at a lamp filled with an element. Figure 6 shows the spectrum of a helium discharge lamp collected using a commercial spectrometer. The spectrum is not continuous like that of a blackbody. Instead, we observe individual spikes at very specific wavelengths. And, we already know the source of these spikes! Atoms have energy levels, and the atoms will only absorb and emit at specific wavelengths. Filling a lamp with a specific element, or the combination of a few elements, and collecting the emitted light with a spectrometer was the most common form of spectroscopy before the invention of the laser. After the spectrum was collected, physicists had to be very clever to back out the energy levels from all of those lines.
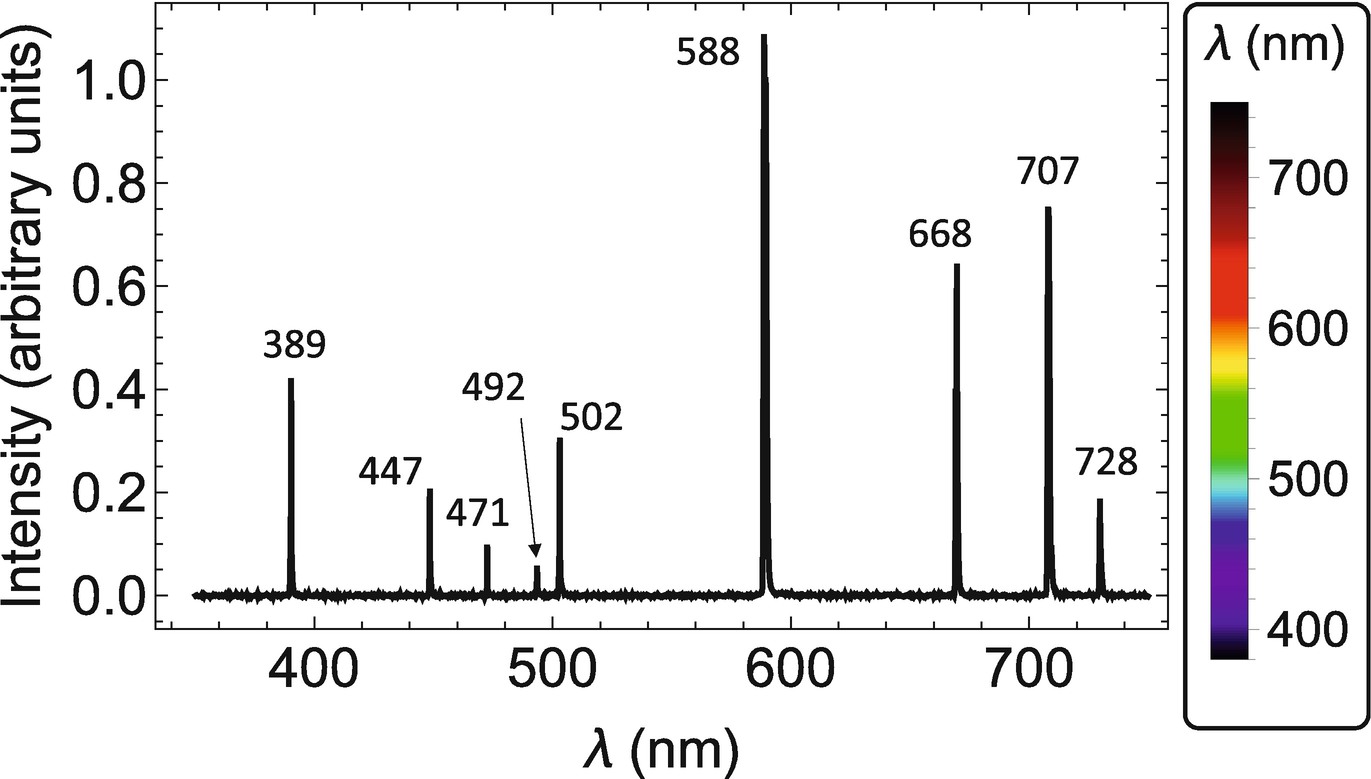
Figure 6:Spectrum collected from a helium discharge lamp collected using a spectrometer with an accuracy of 0.5 nm
Whether you use a white light source and look for lost photons or you collect light from a discharge lamp, you gain the same information, which is the wavelengths of light needed to have an atom go from one energy level to another.
In the lab, spectrometers are still really useful tools, but they are not great for certain applications. Below are a few pros and cons to using spectrometers for spectroscopy.
Pros:
You get lots of data all at once.
You get lots of data very quickly.
Cons:
The resolution is limited. You need to get different wavelengths far enough apart to distinguish between them. For example, let’s see how far apart 450.334 nm is from 450.335 nm using (2) with , , and :
That is small! A possible solution is to make a bigger spectrometer, but then you will have to worry about thermal drifts, how well you can uniformly space the grating slits, and how well you can measure d. In short, it becomes really hard if you want really high resolution.
The data can be hard to interpret. Getting all the data at once means you are getting all transitions from your atom or molecule all at once. A spectroscopist has to figure out what line comes from what transition (pair of energy levels), which is not an easy task!
For high precision spectroscopy, most spectroscopy groups use a laser to study a single transition instead of collecting light from many transitions at once. As we will find in 4. Atoms in Motion, having atoms moving around (i.e., a hot gas) is a bad thing if we want to measure something like the energy difference between two energy states to really high precision. Clever physicists developed a neat technique to still use hot atoms to measure properties to high precision, which is the topic of 5. Saturated Absorption Spectroscopy, but we need multiple lasers to do so.
Problems
Table 2.1 Helium energy levels
| Level # | Energy () | Lines with this lower level |
|---|---|---|
| 1 | 0 | |
| 2 | 159,856.0 | 389 nm |
| 3 | 166,277.4 | 502 nm |
| 4 | 169,086.8 | 447, 471, and 707 nm |
| 5 | 171,134.9 | 492 and 728 nm |
| 6 | 183,236.8 | |
| 7 | 184,864.8 | |
| 8 | 185,564.6 | |
| 9 | 186,209.4 | |
| 10 | 190,298.1 | |
| 11 | 191,446.5 |
```{exercise}
:label: prob-2-7
:enumerator: 2.7

You want to design your own spectrometer to measure light collected from a lamp. You need to collect data for light with wavelengths between 1000 and 3000 nm. You have a number of different gratings that you can pick from, each with a different *d*. What are a few examples of a bad choice for *d*? What is an example of a good choice for *d*?(b) Use Wien’s displacement law to assess your answer. (In other words, does Wien’s displacement law confirm the peak of your graph in part (a)?)
```{exercise}
:label: prob-2-10
:enumerator: 2.10

**(Advanced Problem)**

- (a) Using your favorite numerical program, numerically find and plot the wavelength of maximum spectral wavelength ($\lambda _{\text{peak}}$) for temperatures between 3000 and 6000 K in steps of 100 K.[^6]
- (b) Fit your data to b/T to find b. Be sure to use the speed of light accurate to, at least, 5 digits.I feel like this might be the understatement of the millennium.
Boltzmann’s constant was named by Max Planck in honor of the Austrian physicist and philosopher Ludwig Boltzmann.
The units are, admittedly, confusing! As a rough interpretation, you can think of these units as telling you how much light is being emitted from a blackbody at a given wavelength. If you look at Figure 3, there is more light being emitted at 500 nm than 700 nm, so the spectral radiant exitance is larger at 500 nm. This is what we mean by “per unit wavelength.”
Named after the Carinthian Slovene physicist, mathematician, and poet Josef Stefan, who empirically found the relationship, and Austrian physicist and philosopher Ludwig Boltzmann, who derived the equation.
Spectral radiant exitance is the radiant flux emitted by a surface per unit area per unit wavelength. Spectral irradiance is the radiant flux received by a surface per unit area per unit wavelength. You can think of spectral radiant exitance as what leaves the sun and spectral irradiance as what hits the earth.